Collect! Log Viewer
The Collect! Log Viewer provides a comprehensive way to
track all operations in your Collect! system. It may be used
to check the time taken for certain processes or to
diagnose issues you may be having. It is very useful for
reporting details when requesting technical support. The
Collect! Log Viewer is accessed when you select
Application Log from the System, Diagnostics menu.
Operations are logged in a database table named application_log.
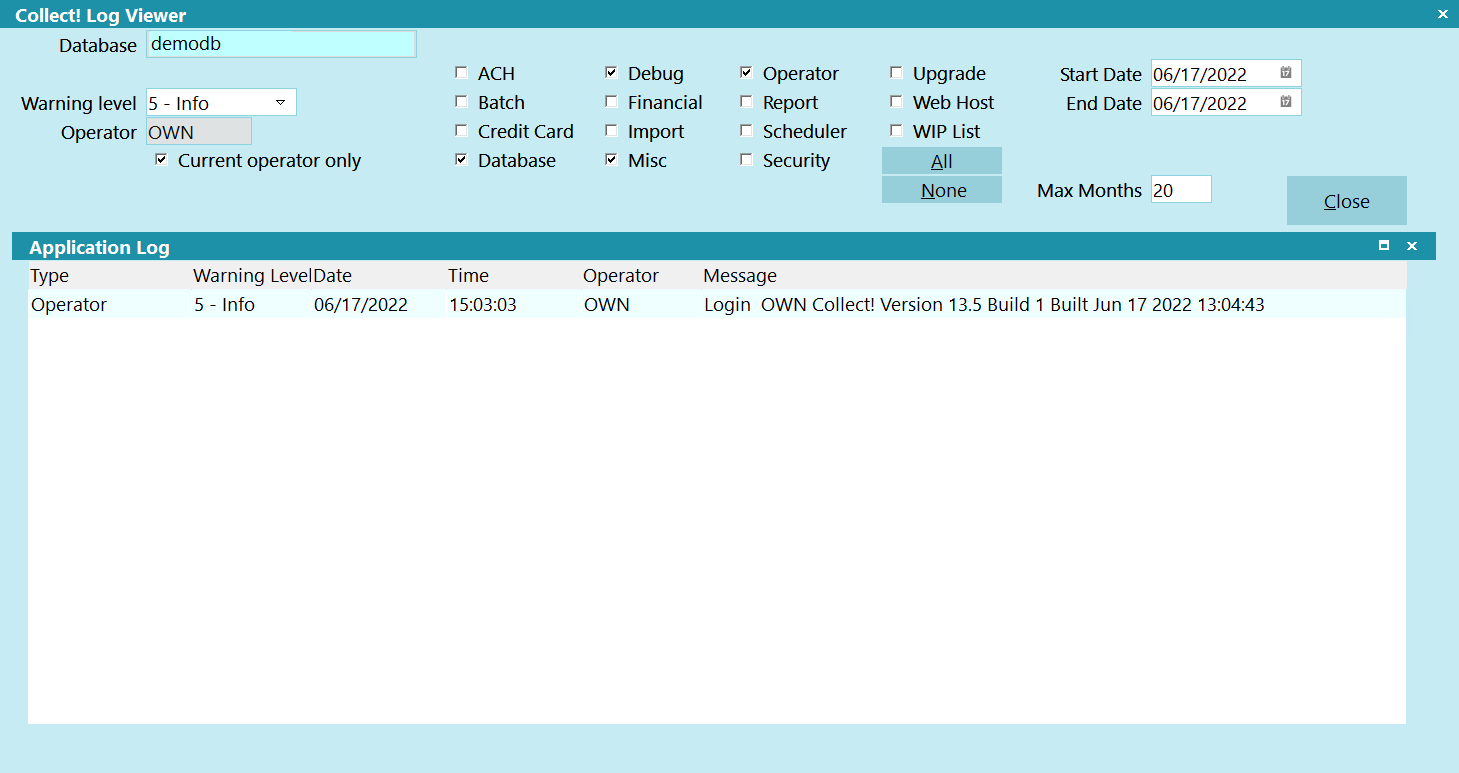
Collect! Application Log Viewer
The Collect Log table is rotated when it reaches an age set
by you. The default age is 20 years.
Database
Select the name of a registered Collect! database. By default, the
current database is populated.

Warning Level
You can choose the level of importance you want to display.
Only messages equal to the indicated value will be displayed.
Select "All" to display all messages.
The levels are:
- Critical (least verbose)
- Error
- Warning
- Notice
- Info (most verbose)
Operator
Enter an Operator ID to view entries specific to the
indicated operator. If you leave this field blank, entries for
all Operators are listed.
If you switch ON 'Current operator only' then this field
becomes Read Only.
 Two switches in the Operator Security form
enable you to keep track of accounts viewed
and/or modified by each operator.
Two switches in the Operator Security form
enable you to keep track of accounts viewed
and/or modified by each operator.
Current Operator Only
Switch this ON to filter the entries in the Log Viewer
window to only show events logged to the Operator
you are signed in as. When this switch is ON, the
Operator field cannot be edited.
Log Types
You can select one or several or all types of logs to display
in the Log Viewer. Switch ON with a check mark and the
window contents change to match your selection.
ACH
Switch this ON with a check mark to show log entries
relating to ACH transactions.
Batch
Switch this ON with a check mark to show log entries
relating to batch processes. Typical entries will be the
start and end times of the batch and the type of batch
performed. Additional information may be logged depending
on the results of the batch.
Credit Card
Switch this ON with a check mark to show log entries
relating to credit card transactions.
Database
Switch this ON with a check mark to show log entries
relating to the Collect! database as a whole, for instance
connectivity issues.
This switch also displays extension module issues when
the "Enable internal debug checks" switch is enabled in
Collect!, If an extension module call fails, an 'em_call' error log
entry will display the FUNCTION ID code. This identifies
the function in the extension module that was being called.
This will be used to troubleshoot the issue.
The "Enable internal debug checks" switch is enabled through
System->Preferences->Options, Sounds and Colors.
Debug
Switch this ON with a check mark to show log entries
relating to debugging. This is useful for troubleshooting
by developers and technical support. Generally, these
sorts of entries are generated if you have 'Verbose and
debug' switched ON in the Screen and Messages form.
Financial
Switch this ON with a check mark to show log entries
relating to financial areas of Collect!, for instance,
Interest.
Import
Switch this ON with a check mark to show log entries
relating to importing data. Entries in this area are logged
during import routines.
Misc
Switch this ON with a check mark to show log entries
that are general in nature and do not fit in the other
types of logs.
Operator
Switch this ON with a check mark to show log entries
that are specific to particular operators.
Report
Switch this ON with a check mark to show log entries
relating to report writer and printing functions.
Scheduler
Switch this ON with a check mark to show log entries
relating to scheduler processes. Typical entries will be the
start and end times of the task and the type of task
performed. Additional information may be logged depending
on the results of the batch.
Security
Switch this ON with a check mark to show log entries
relating to access rights, passwords and
Secure Socket Layer.
Upgrade
Switch this ON with a check mark to show log entries
relating to database upgrades.
Web Host
Switch this ON with a check mark to show log entries
relating to Web Host usage.
WIP List
Switch this ON with a check mark to show log entries
relating to working the WIP List.
All
Select this button to show all the log entries for every
category.
None
Select this button to clear all the check boxes at once
for every category.
Max Months
Enter the maximum number of years to keeps log entries.
The default is 20 months. Any entries older than today,
less the number of months will be deleted from the
Application Log table.
Alter this value to increase or decrease the age of the
logs to keep.
Application Log
Click into the Application Log list to see details of the
entries. You can maximize the screen and use scroll
bars to view entries.
Type
Displays the types of operation for the event.
Warning Level
This indicates a number that may be used to filter
the log.
Date
This is the Date of the event.
Time
This is the Time of the event.
Operator
This is the Operator ID for whom the event occurred.
Message
This is the information to be logged. It may indicate a particular
Error Return Code or more general information to be used for
troubleshooting or tracking.
Close
Select the CLOSE button to close the
Collect! Log Viewer window and return
to the previous screen.
Reporting
As the logs are stored in the database, you can create reports
using the applicable print codes or SQL queries.
| 
Was this page helpful? Do you have any comments on this document? Can we make it better? If so how may we improve this page.
Please click this link to send us your comments: helpinfo@collect.org