Collect! Log Viewer
The Collect! Log Viewer provides a comprehensive way to
track all operations in your Collect! system. It may be used
to check the time taken for certain processes or to
diagnose issues you may be having. It is very useful for
reporting details when requesting technical support. The
Collect! Log Viewer is accessed when you select
Application Log from the System, Diagnostics menu.
Operations are logged to a file named "collect_log_{n}.txt,"
where{n} indicates the log number. By default, this file is
located in the local Collect\Log Files
folder. This location may be modified to suit your needs.
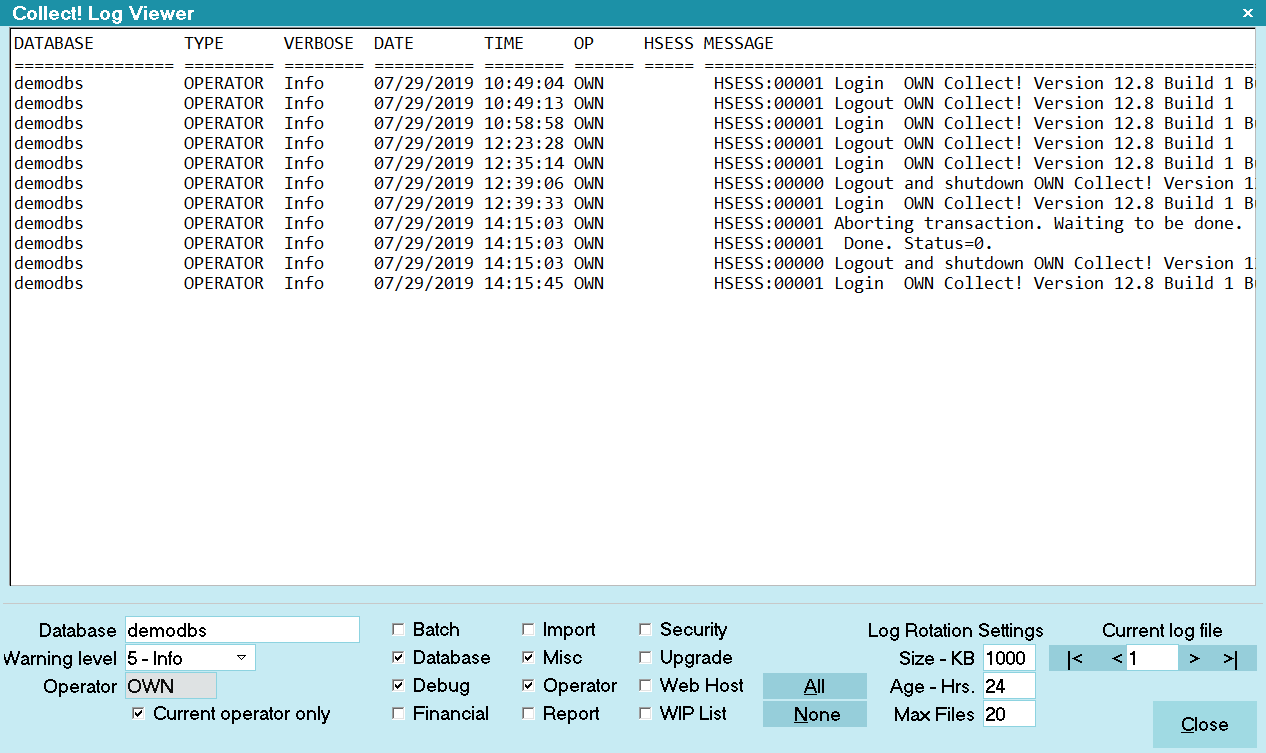
Collect! Application Log Viewer
The Collect Log File is rotated when it reaches a size set
by you, or after a certain length of time. You can also set
the number of log rotations to store.
The log file is 100% ASCII text. Each entry displays the following fields:
Database
Logtype
Verbose
Time
Operator
Message
Log View Text
Click into the Log Viewer Text area see details of the
entries. You can maximize the screen and use scroll
bars to view entries. The Log Viewer sub-window displays
entries in Collect!'s Text Editor in Read Only mode.

Database
This is the Collect! database that is specific for the event, e.g. "Demodb"
or "Masterdb." In the event that you are not connected to a database
when the event occurs, this will display as "Not connected."
Logtype
The following list shows the types of operations that are logged.
1. BATCH - Batch Processing
2. DATABASE - Database errors related to Collect!, e.g. Connectivity
3. DEBUG - Used for programmers and technical support, i.e. Troubleshooting.
4. FINANCIAL - Financial areas of the software, e.g. Interest
5. IMPORT - Import module functionality
6. MISC - Miscellaneous content
7. OPERATOR - Operator specific events
8. REPORT - Report writer and printing functionality
9. SECURITY - Access rights - Passwords - Secure Socket Layer.
10. UPGRADE - Upgrade Database and a new version Update
11. WEB HOST - Web Host related functionality
12. WIP LIST - Working the WIP list
Verbose
This indicates a number that may be used to filter
the log. You can display all messages (5) or only
display the most critical (1) or choose a value in
between.
1. Critical (least verbose)
2. Error
3. Warning
4. Notice
5. Info (most verbose)
Time
This is the Date and Time of the event in
Collect! syntax format.
Operator
This is the Operator ID for whom the event occurred.
Message
This is the information to be logged. It may indicate a particular
Error Return Code or more general information to be used for
troubleshooting or tracking.
Log Viewer
There are many choices in the Collect! Log Viewer. Each
choice allows you to filter the results that you see in the
Log Viewer window. Log Viewer content is Read Only.
You may print the results to screen or to file or to
Technical Support.
Database
Select a registered Collect! database from the pick list
or select 'All'.
This will display only log entries specific the indicated
database or 'All' to disregard any database specific criteria.
You also input a user defined database search in the event
of a database being deleted yet log files containing entries
for the defined deleted database. Default is the database
you are currently signed into otherwise 'All'.
Warning Level
You can choose the level of importance you want to display.
Only messages less than and equal to the indicated value will
be displayed. For example, if you select 'Warning" which is a
value of 3, you will also see Error and Critical messages.
Select "Info" to display all messages.
The levels are:
1. Critical (least verbose)
2. Error
3. Warning
4. Notice
5. Info (most verbose)
Operator
Enter an Operator ID to view entries specific to the
indicated operator. If you leave this field blank, entries for
all Operators are listed.
If you switch ON 'Current operator only' then this field
becomes Read Only.
 Two switches in the Operator Security form
enable you to keep track of accounts viewed
and/or modified by each operator.
Two switches in the Operator Security form
enable you to keep track of accounts viewed
and/or modified by each operator.
Current Operator Only
Switch this ON to filter the entries in the Log Viewer
window to only show events logged to the Operator
you are signed in as. When this switch is ON, the
Operator field cannot be edited.
Log Types
You can select one or several or all types of logs to display
in the Log Viewer. Switch ON with a check mark and the
window contents change to match your selection.
Batch
Switch this ON with a check mark to show log entries
relating to batch processes. Typical entries will be the
start and end times of the batch and the type of batch
performed. Additional information may be logged depending
on the results of the batch.
Database
Switch this ON with a check mark to show log entries
relating to the Collect! database as a whole, for instance
connectivity issues.
This switch also displays extension module issues when
the "Enable internal debug checks" switch is enabled in
Collect!, If an extension module call fails, an 'em_call' error log
entry will display the FUNCTION ID code. This identifies
the function in the extension module that was being called.
This will be used to troubleshoot the issue.
The "Enable internal debug checks" switch is enabled through
System->Preferences->Options, Sounds and Colors.
Debug
Switch this ON with a check mark to show log entries
relating to debugging. This is useful for troubleshooting
by developers and technical support. Generally, these
sorts of entries are generated if you have 'Verbose and
debug' switched ON in the Screen and Messages form.
Financial
Switch this ON with a check mark to show log entries
relating to financial areas of Collect!, for instance,
Interest.
Import
Switch this ON with a check mark to show log entries
relating to importing data. Entries in this area are logged
during import routines.
Misc
Switch this ON with a check mark to show log entries
that are general in nature and do not fit in the other
types of logs.
Operator
Switch this ON with a check mark to show log entries
that are specific to particular operators.
Report
Switch this ON with a check mark to show log entries
relating to report writer and printing functions.
Security
Switch this ON with a check mark to show log entries
relating to access rights, passwords and
Secure Socket Layer.
Upgrade
Switch this ON with a check mark to show log entries
relating to database upgrades.
Web Host
Switch this ON with a check mark to show log entries
relating to Web Host usage.
WIP List
Switch this ON with a check mark to show log entries
relating to working the WIP List.
All
Select this button to show all the log entries for every
category.
None
Select this button to clear all the check boxes at once
for every category.
Log Rotation Settings
The Collect Log will be rotated according to the settings
you choose. You can pick a maximum size in Kb or
an age in hours.
Size - Kb
Rotate Collect Log when it reaches this size. (Kb)
Age - Hrs
Rotate Collect Log when it is this old. (Hrs.)
Max Files
This is the maximum number of log files to store.
When the maximum number to keep is reached,
the older files will be deleted as needed. The most
recent file will always be number 1.
Current Log File
This field displays the number of the Collect Log
you are viewing. By default it will show the
number "1" which is always the log file currently
being written to. You can select a different log to
view historical events.
The most recent log will always be Collect Log 1.txt.
Older logs will be numbered Collect Log 2.txt and so
on. When the maximum number to keep is reached,
the older files will be deleted as needed.
Select the navigation buttons to rotate through the
available Collect Logs.
Close
Select the CLOSE button to close the
Collect! Log Viewer window and return
to the previous screen.
List Block Errors
The Application Log displays list block error entries in
the "Debug" category. When you get a list block error,
Collect! will give you a prompt the first time (original design),
then continue to only log further errors (20 max).
Example log entry:
demodb DEBUG Error 1/13/2009 09:11:24 OWN
00001 List Block Error (LST_BAD_PTR) Count: 7
"Count" is the total number of list block errors that have
occurred during a Collect! session.
 When a user gets a list block error prompt,
they should really close Collect! since continuing may risk
damaging their data.
When a user gets a list block error prompt,
they should really close Collect! since continuing may risk
damaging their data.
Summary
The Collect! Log Viewer is a user-friendly comprehensive
event logging system. All messages and system return
codes are displayed in one screen with settings you can
customize. System diagnosis is greatly simplified and
streamlined for easy tracking and troubleshooting.
| 
Was this page helpful? Do you have any comments on this document? Can we make it better? If so how may we improve this page.
Please click this link to send us your comments: helpinfo@collect.org