Diagnostics
The Diagnostics Menu enables you to view Collect!'s
Application log, as well as the Credit Bureau log and
additional system information. This provides a wealth
of information for troubleshooting and documenting
procedures.
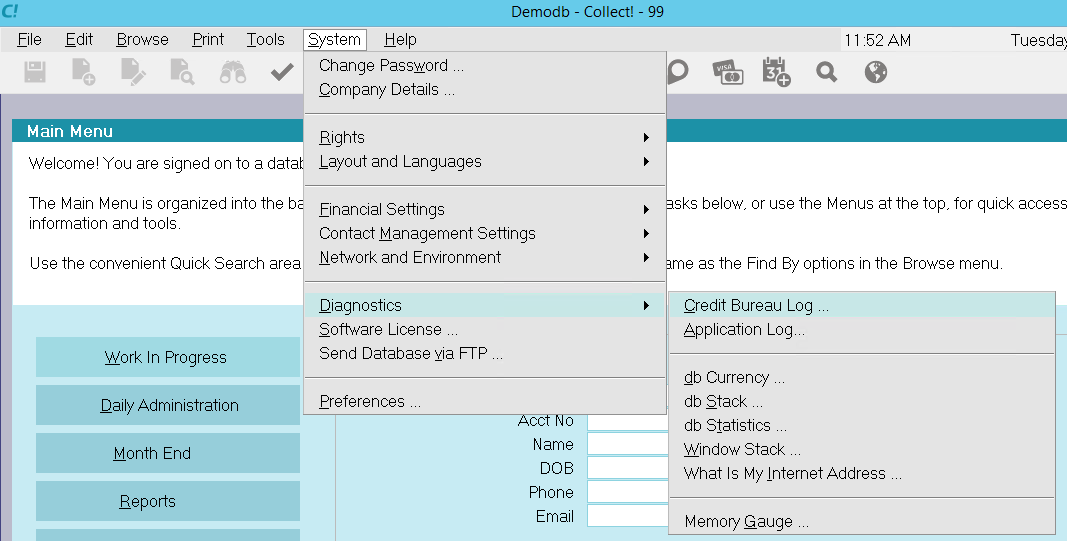
Diagnostics Menu
Information is provided as follows:
* Credit Bureau Log
* Application Log
* Db Currency
* Db Stack
* Db Statistics
* Window Stack
* What Is My Internet Address
* Memory Gauge
Credit Bureau Log
Select this option to view the cbrlog.txt.
This log records all pertinent details when you run your
credit report. Results of the reporting procedure are
displayed. These include the number of files
processed, the total money value and the number
of errors encountered.
If you encounter warnings or errors while running
your credit bureau report, be sure to check this file
for more information. Each warning or error displays
the File Number of the account so that you may
visit it to correct errors or deal with warnings.
After viewing the log, you will be prompted to
clear it. Only select YES if you are ready to
erase the entire contents of the log.

Application Log
Select this option to open the Collect! Log Viewer
where all logged system operations may be viewed.
This is a comprehensive utility that enables you
to examine system messages and error messages
for diagnosing and tracking events. Types of events
logged include operator activity, batch processes,
record deletions, anomalies in normal operations,
report printing, and data importing. Many choices
exist for viewing the available information.
Please refer to Help topic, Collect! Log Viewer for
details.
Db Currency
This function displays the current record
and all access paths to that record. It also
displays the database addresses of the
related records.
Db Stack
This function displays the currently open
forms, the database address of each record
in the stack, the record lock holder, and
the form operating mode and status.
Db Statistics
Select this to open the RDM Server Statistics form where
you can view the full content of a call to gather statistics
from the RDS Server. You can refresh the statistics by
selecting the REFRESH button.
 Db Statistics are used primarily by the
Technical Services Team to
benchmark server performance.
Db Statistics are used primarily by the
Technical Services Team to
benchmark server performance.
The statistics that are displayed refer to the current
state of the RDM Server and the EXM (Extension
module).
Window Stack
This function displays a list of currently open windows.
What Is My Internet Address
This option enables you to fetch your external IP address.
Collect! accesses the web site, www.whatismyip.com, and
then displays the IP Address fetched by the site.
While Collect! attempts to fetch the IP Address,
a dialog will be displayed. Success results in
the IP Address being displayed. Failure to obtain
the IP due to a network issue or firewall will
result in a message indicating failure.
Memory Gauge
This command displays the current state
of memory allocation within Collect!.
| 
Was this page helpful? Do you have any comments on this document? Can we make it better? If so how may we improve this page.
Please click this link to send us your comments: helpinfo@collect.org