Dashboard Landing Page
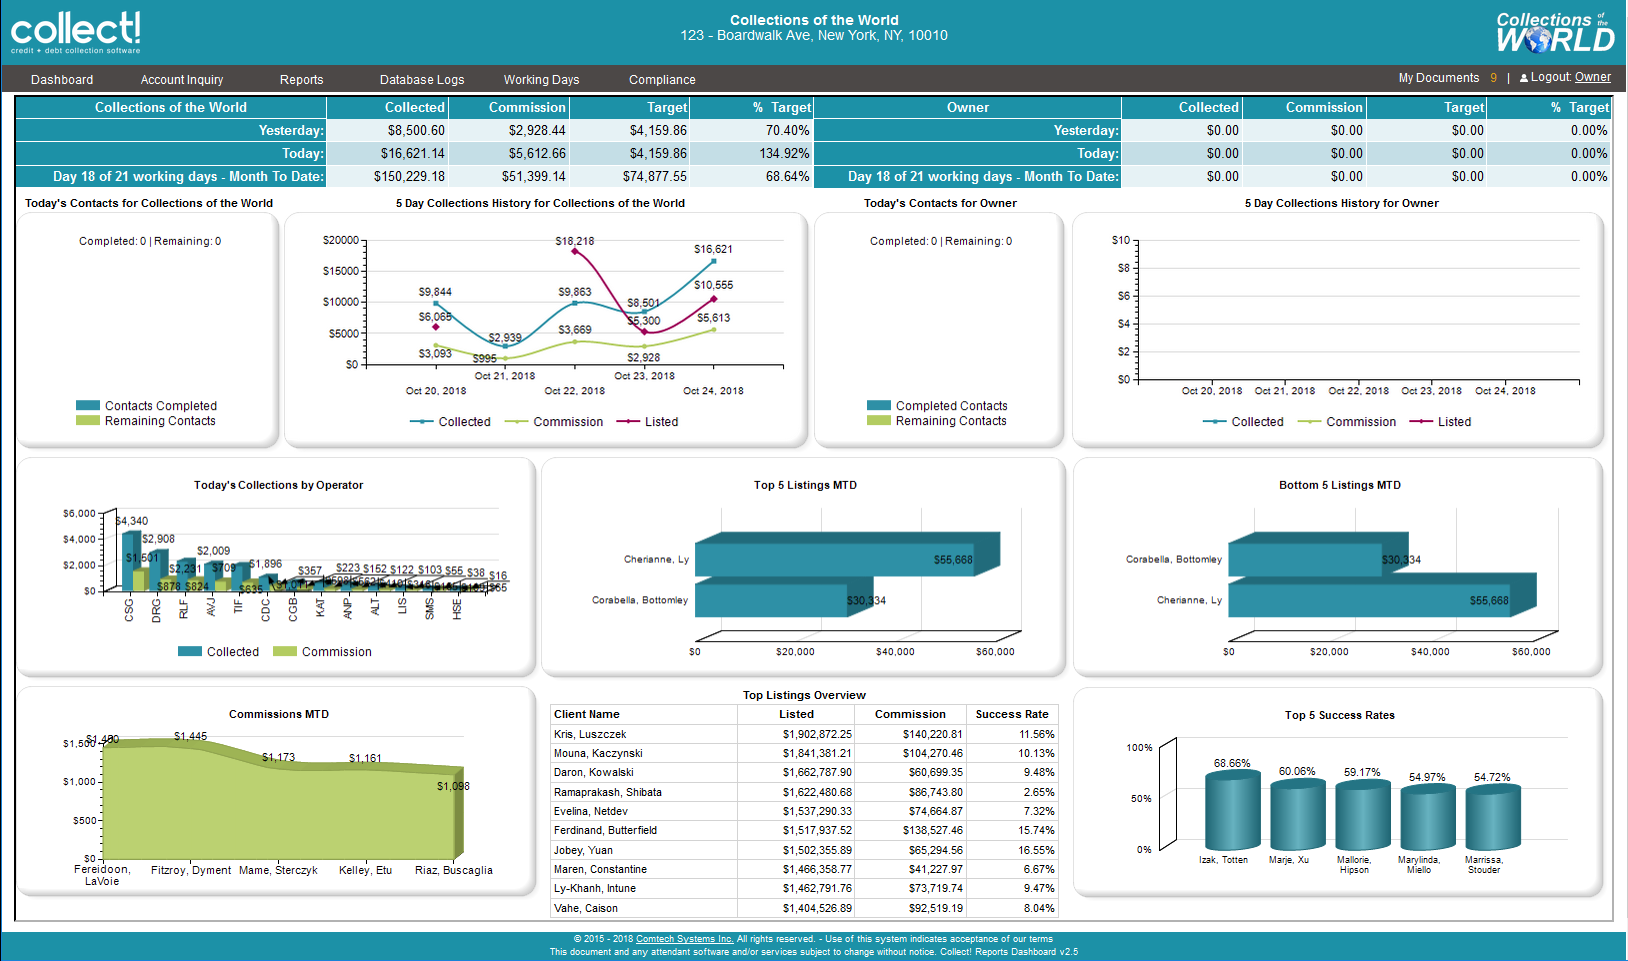
The Dashboard is set to open on the Dashboard Landing Page to provide a real-time,
high level graphic performance overview. Data is presented in graphs and charts
including the following:
* Collected, Commission, Target and % of Target Collected Yesterday, Today,
Month to Date where the Management view shows results for the user and the
entire operation, and where Client and Collector views show only their results.
* Today's Contacts for entire operation completed and remaining
* Today's Contacts for the user completed and remaining
* 5 Day Collections History for entire operation showing listed, commission, listed
* 5 Day Collections History for user
* Today's Collections by Operator, collected and commission
* Top Listings Month to Date
* Bottom Listings Month to Date
* Commissions Month to Date
* Top Listings Overview in table format
* Top 5 Success Rates
Dashboard Landing
| 
Was this page helpful? Do you have any comments on this document? Can we make it better? If so how may we improve this page.
Please click this link to send us your comments: helpinfo@collect.org