Collect!'s Report Generator Utility enables you to select data, apply filters and
sorting criteria to produce custom reports in Collect! outside of Collect!'s
more complex Report Writer Engine.
The Report Generator offers a range of output formats including HTML, printer, files, emails
and reports. Many outputs can be stored for repeat use.
This tool has three streams Basic, Advanced and Internal:
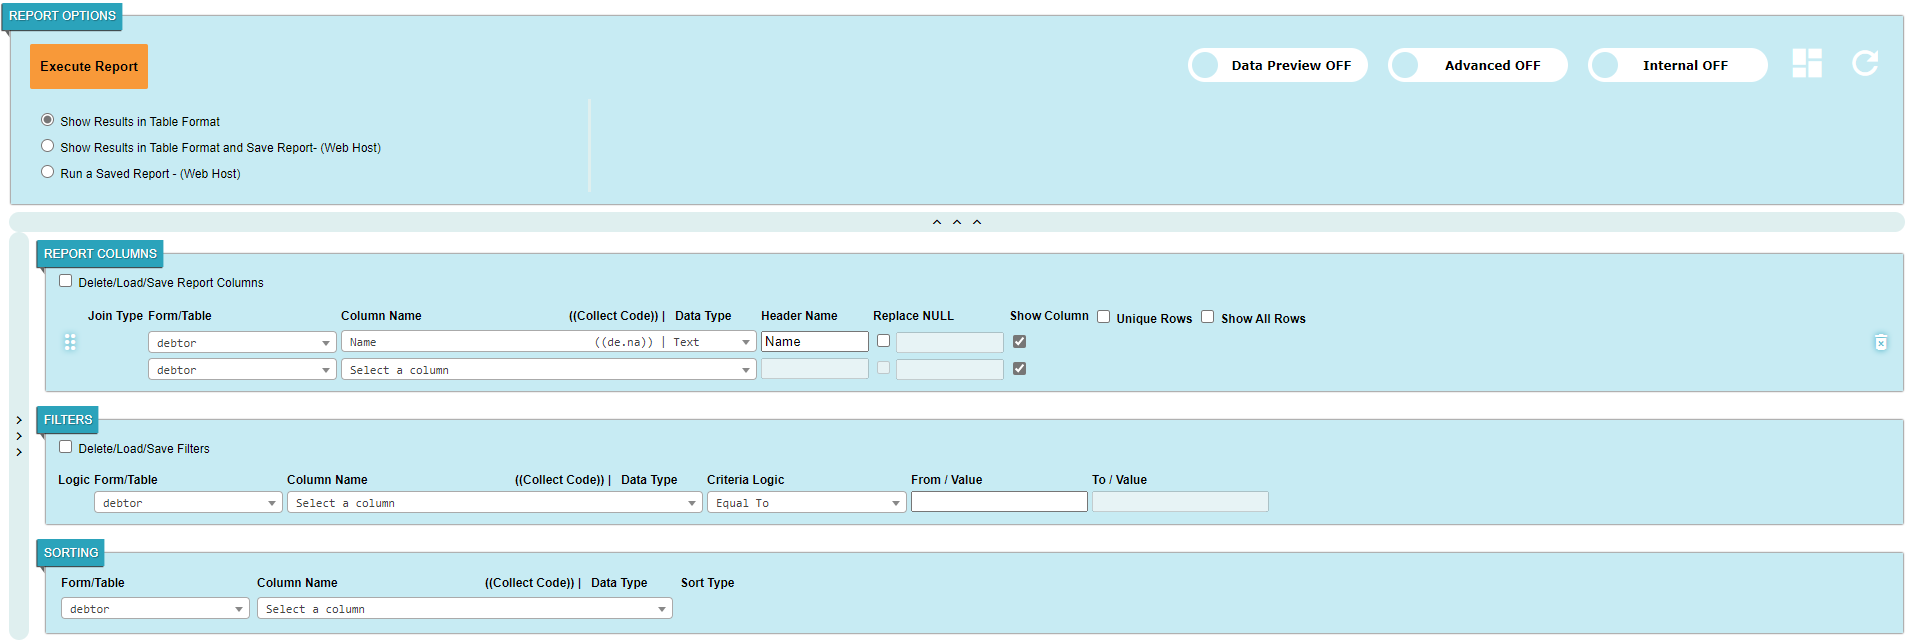
Basic (Advanced OFF): By default the report generator utility is set to basic stream, and it
provides users
with all the basic options needed to generate reports or to run a saved report. The transition from basic stream to advanced stream
is minor and no changes will be lost.
Report Generator - Basic Stream
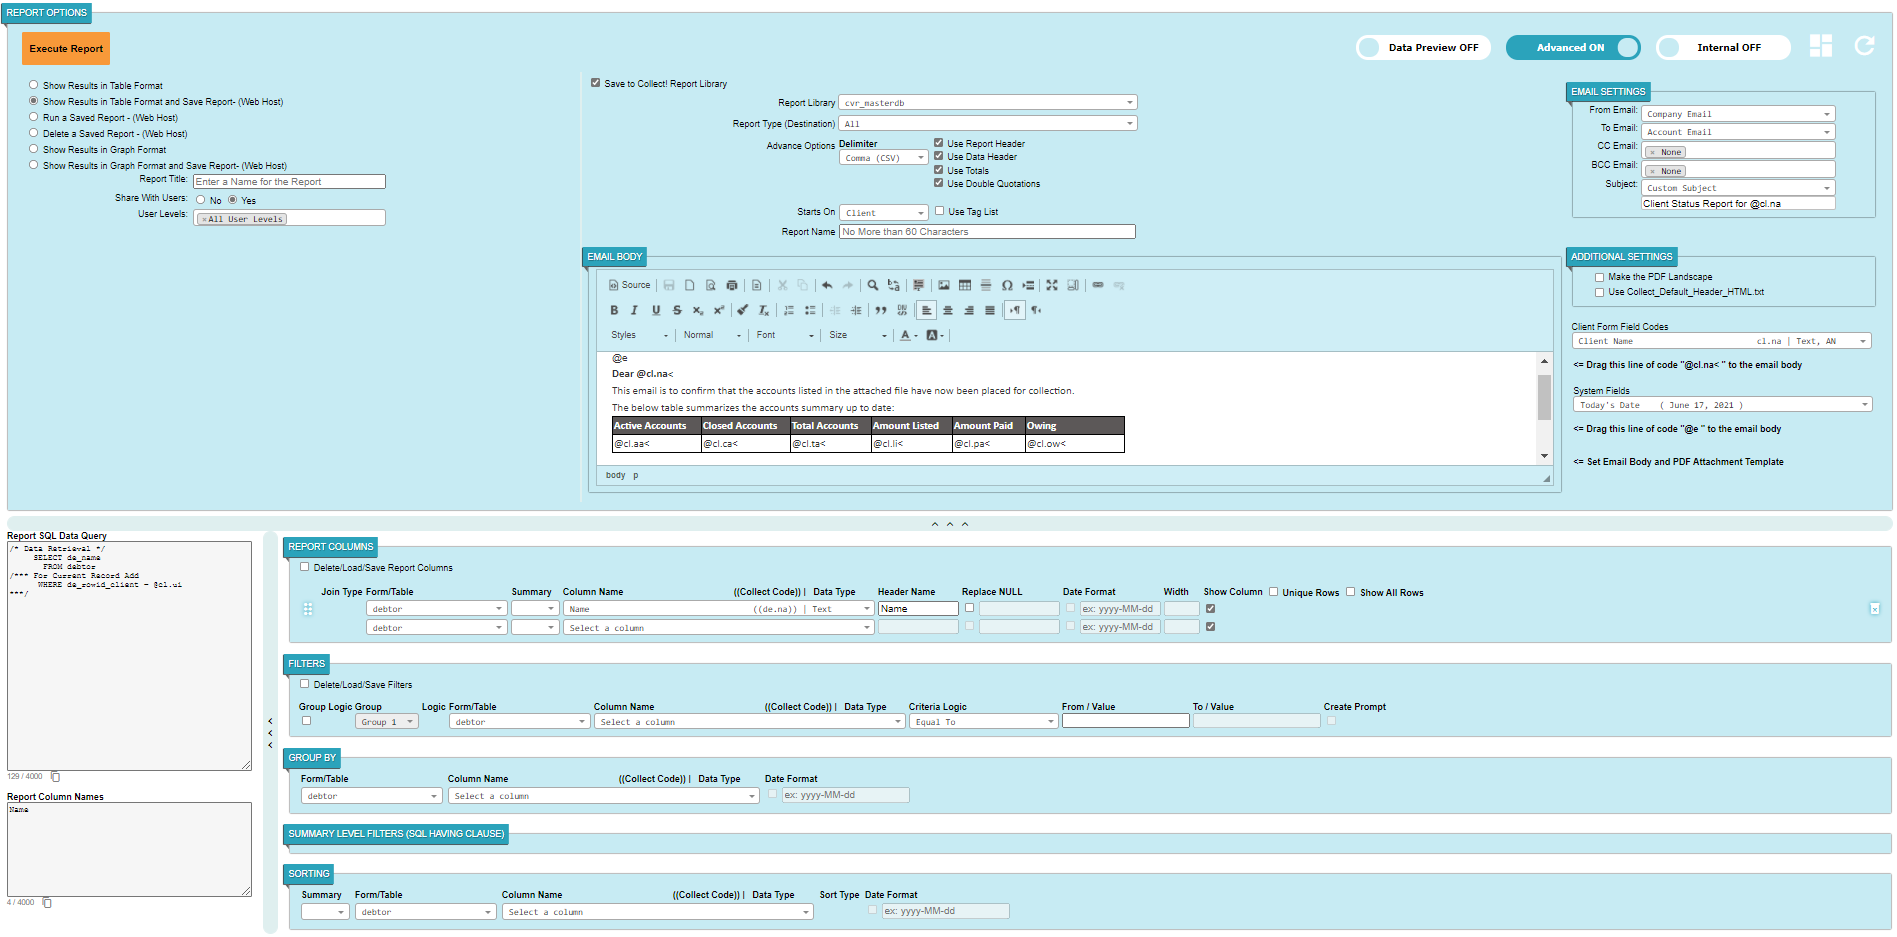
Advanced (Advanced ON): This stream provides the user with almost
all of the report generator functionality. When you move back to the basic stream from the advanced stream the utility has
to reload the page which will cause all the information on the advanced page to be lost. You can save your settings
before proceeding with this option.
Report Generator - Advanced Stream
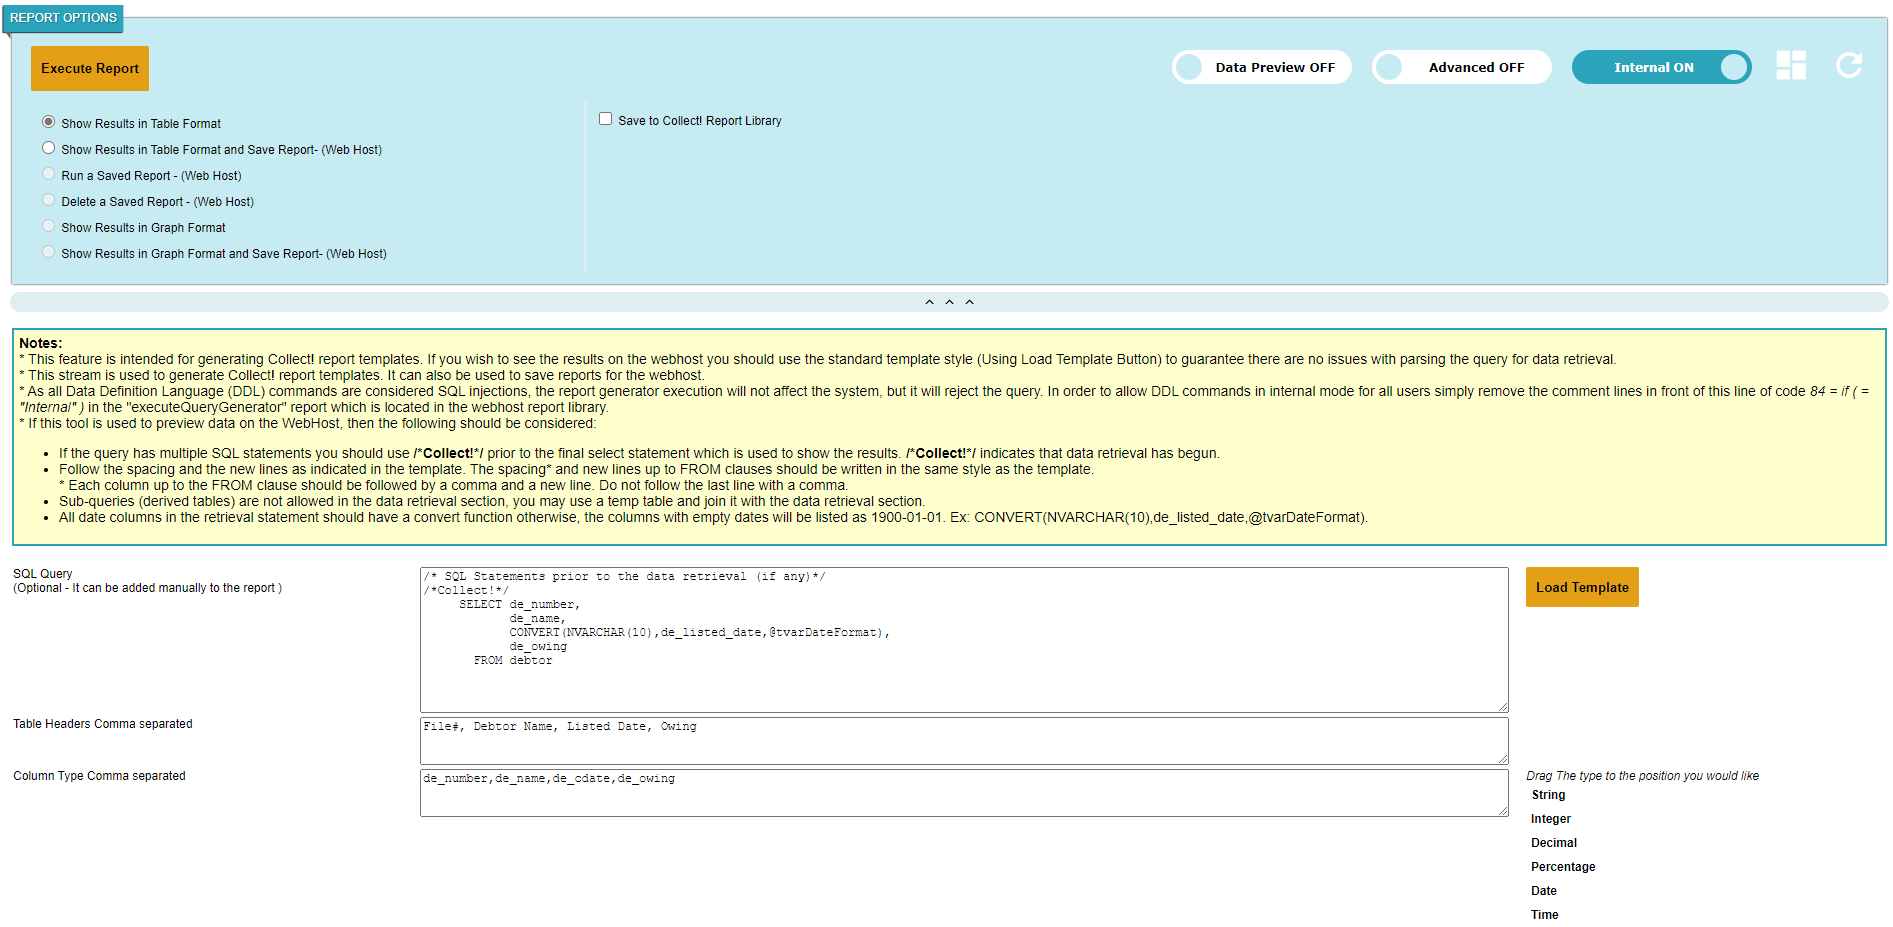
Internal: This stream is meant for users with Collect! database schema and
SQL knowledge. Turning this stream on or off will also reload the page.
* This option is not visible for user levels 97 and 98.
Report Generator - Internal Stream
Collect's Report Generator (RG) has three main sections: 1. Report Options, 2. Query Generator and 3. Results Page.
1. REPORT OPTIONS:
This section is used to select the report options that will determine the report results and whether or not to insert the report into your Collect! library.
Report Generator Options
The report options are:
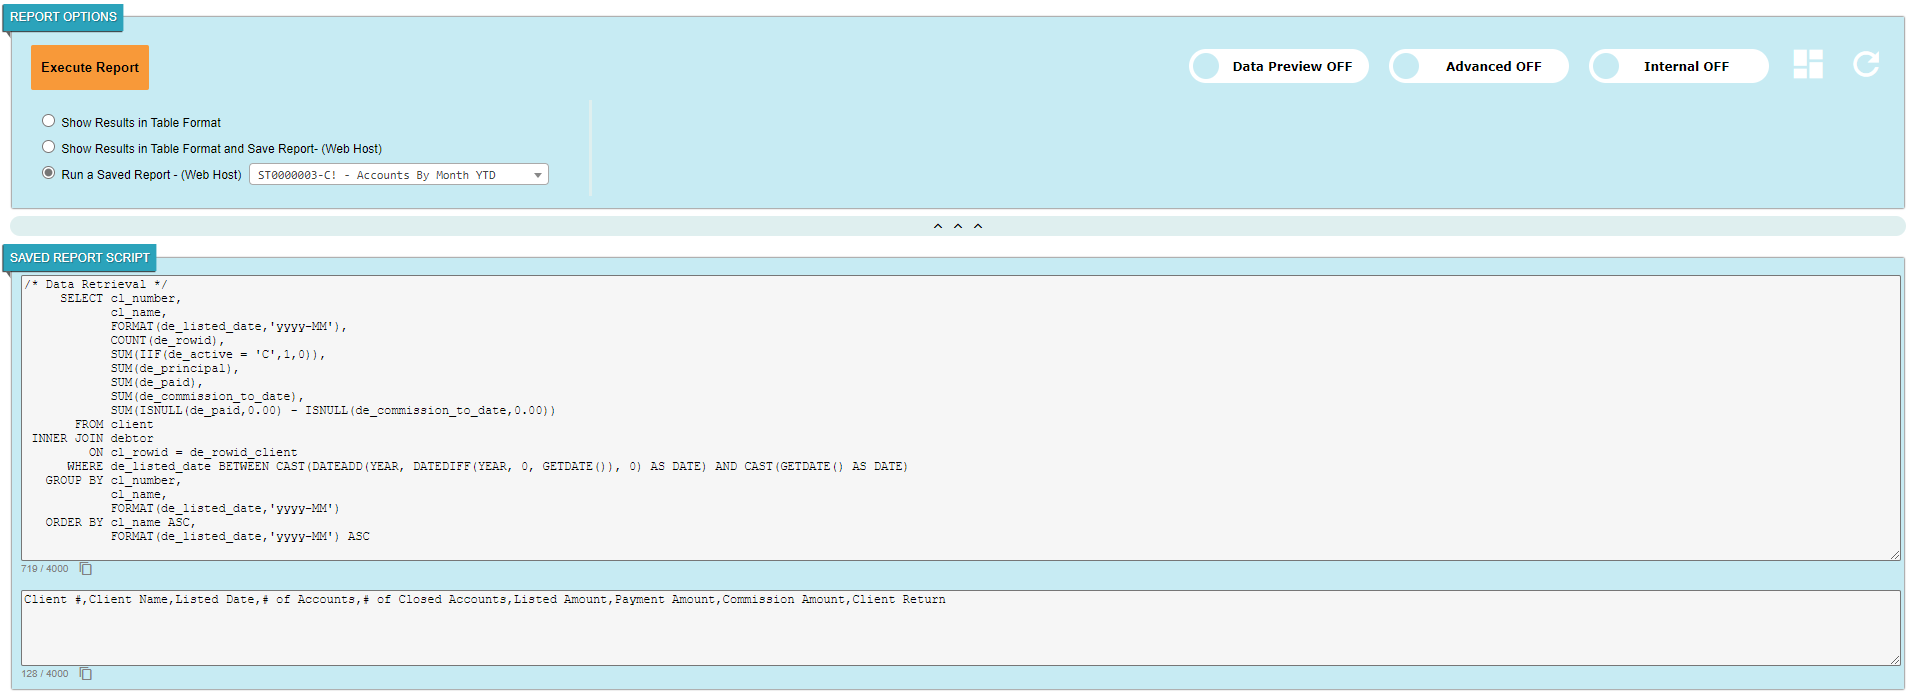
A. Execute Report
All the functionalities/commands of this tool are run by clicking this button or pressing F9 which invokes the clicking functionality.
* When delete a saved report report option is selected this button title changes to Delete Current Report.
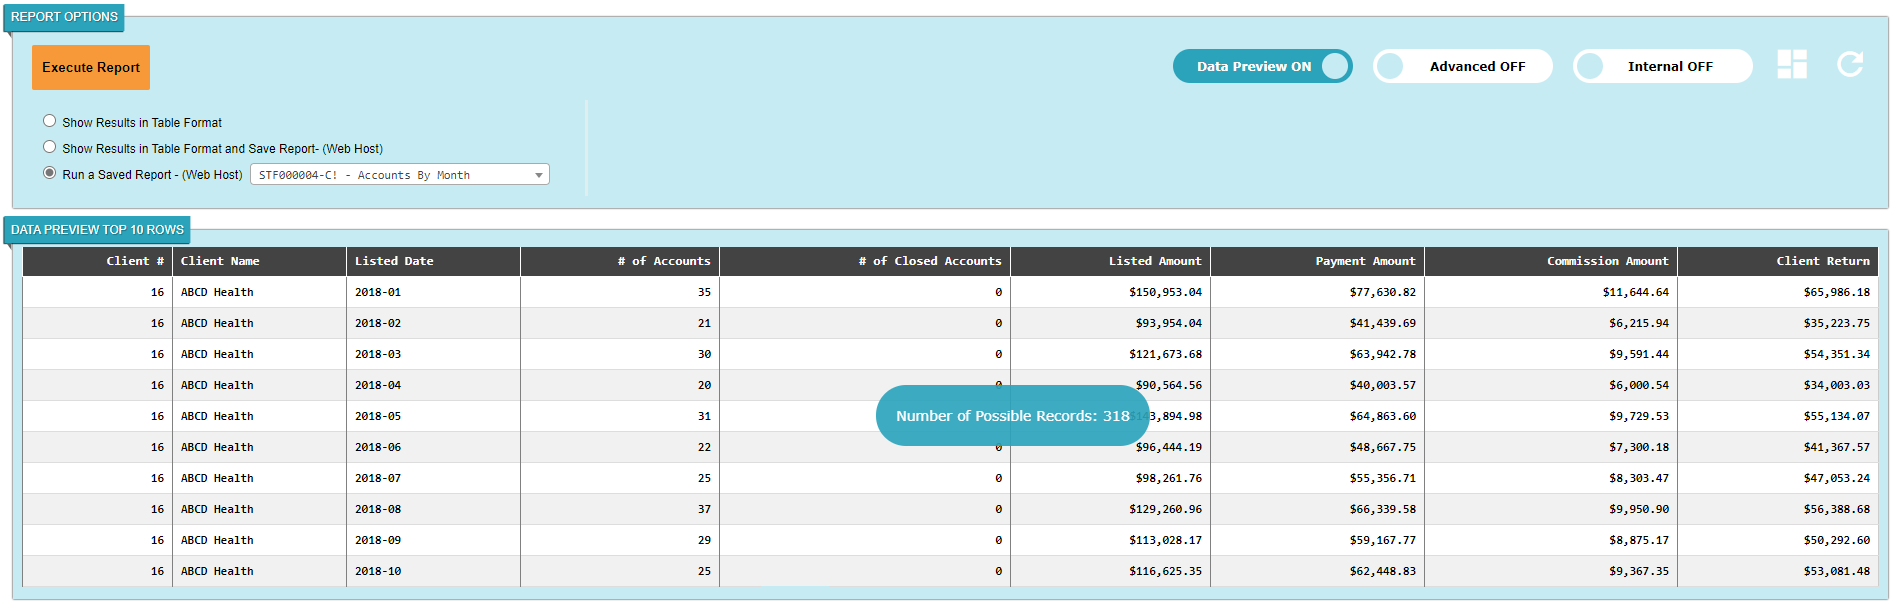
B. Data Preview (ON/OFF)
When this option is set to ON, it shows 10 rows on the fly while making changes. It is recommend NOT to check show all rows
when the Data Preview is ON as it will show all the results and it will slow down the data loading process.
* A flash box message stating "Number of Possible Records: {number}" indicates the total number
of rows that are going to be retrieved using the current query. This message is not visible when the Unique Rows checkbox is checked.
Report Generator Options C. Advanced (ON/OFF)
This button is used to change the report generator stream. (Advanced OFF) indicates basic stream and (Advanced ON) indicates advanced
stream.
* An orange asterisk (*) indicates that this feature
is only visible when the tool is in advanced stream (Advanced ON).
D. Internal:
This button is used to change the report generator to the internal stream. This stream is meant for users with Collect! database schema
knowledge as well as SQL knowledge.
SQL Query: This section is used to send the query to SQL server
for data retrieval.
Table Headers: This section is used for table column headers.
Column Type: This section is used to select the data types in the columns for proper styling of your report.
Load Template: This button will load a sample template to show how this tool can be used.
Drag the type to the position you would like: The buttons under
this section can be dragged into the Column Type area and is used to identify the column type.
The type of columns in the SQL Query area should be in the same sequence as the Column Type area.
Notes:
* This feature is intended for generating Collect! report templates.
If you wish to see the results on the webhost you should use
the standard template style (Using Load Template Button) to guarantee there are no issues with parsing the query
for data retrieval.
* This stream is used to generate Collect! report templates. It can also be used to save reports for the webhost.
* As all Data Definition Language (DDL) commands are considered SQL injections, the report
generator execution will not affect the system, but it will reject the query. In order to allow DDL
commands in internal mode for all users simply remove the comment lines
in front of this line of code @tvarDoIt = @dm.da if ( @varMode = "Internal" ) in the "executeQueryGenerator"
report which is located in the webhost report library.
* If this tool is used to preview data on the WebHost, then the following should be considered:
If the query has multiple SQL statements you should use /*Collect!*/ prior to the final select
statement which is used to show the results. /*Collect!*/ indicates that data retrieval
has begun.
Follow the spacing and the new lines as indicated in the template. The spacing* and new lines up to
FROM clauses should be written in the same style as the template.
* Each column up to the FROM clause should be followed by a comma and a
new line. Do not follow the last line with a comma.
Sub-queries (derived tables) are not allowed in the data retrieval section,
you may use a temp table and join it with the data retrieval section.
All date columns in the retrieval statement should have a convert function otherwise,
the columns with empty dates will be listed as 1900-01-01.
Ex: CONVERT(NVARCHAR(10),de_listed_date,@tvarDateFormat).
E. Report Set Buttondashboard:
This button is used to open the report set page which can be used to build/load multiple reports in one page.
* The report page contains a control menu set that can be moved and folded. To move the control menu set grab the control menu
set and drag it to the position in the page that you prefer. Once dragged to a new place, this control set always stays on top of any other elements in the page.
To hide or display the control set click on the settings button.
Delete a Saved Page:
This option is used to delete the selected page from the dropdown list. When a saved report set page is selected a delete button will
appear. Clicking it will delete the report page.
Load a Saved Page:
This option is used to load a saved page. This is the default behavior of the Report Set utility.
* With both Delete a Saved Page and Load a Saved Page options a dropdown list of all the saved report sets available to that particular user will appear.
Report Set - a Sample of Saved Report Page
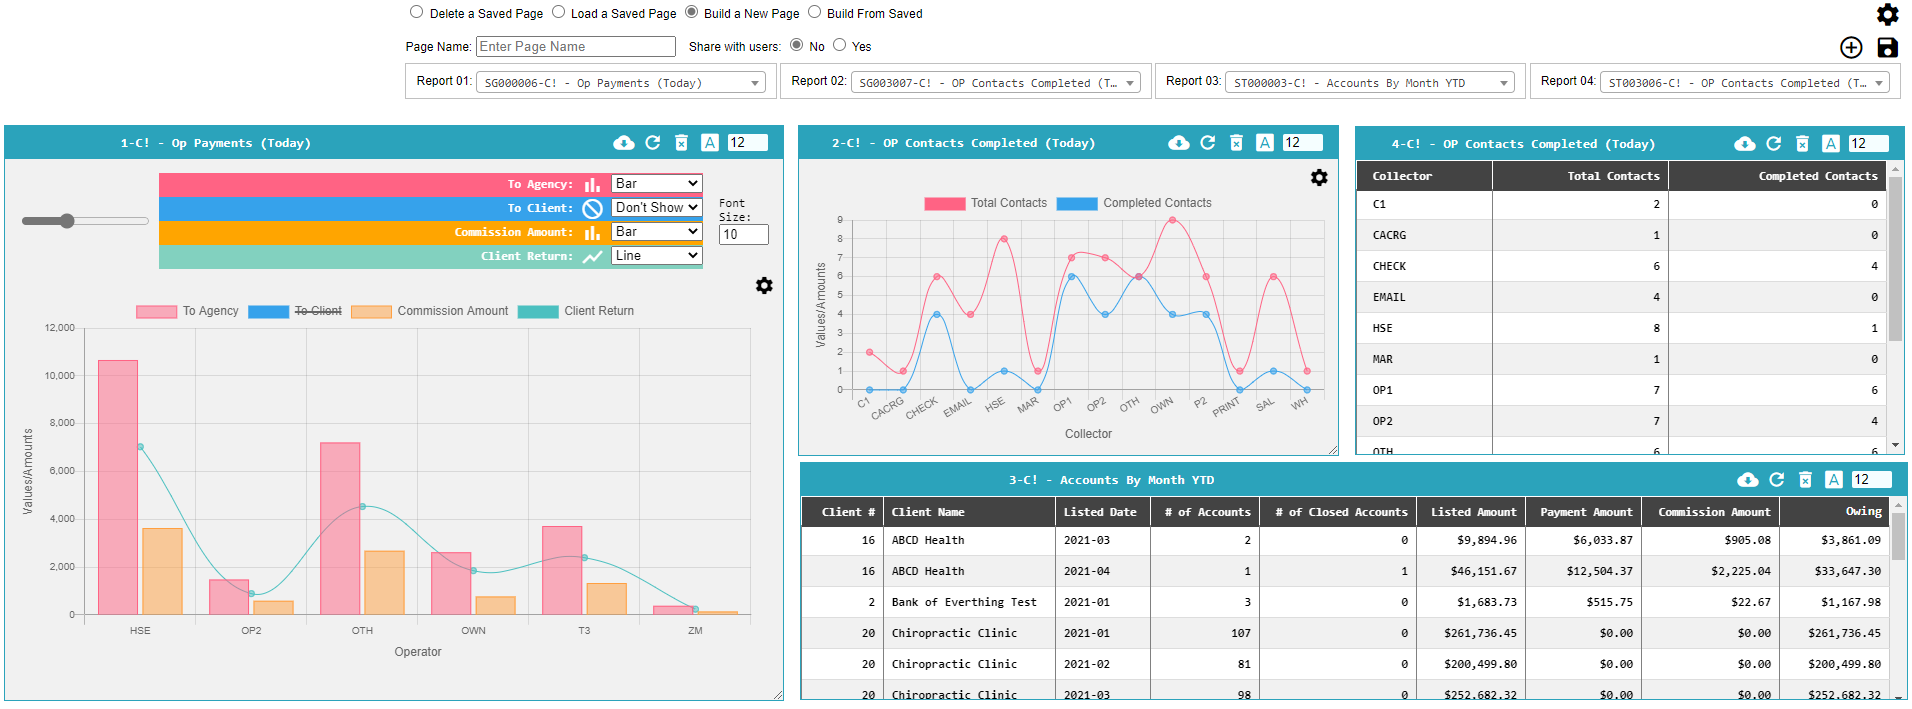
Build a New Page:
This option is used to create a report set page from scratch. When this option is selected the following options will become
visible:
Report Set - Building a New Page
Page Name: This field is used to give the report set page a name
when saved.
Share With Users: When "Yes" is selected it
will show the user levels that can access this set of reports.
To understand Share With Users refer to this.
* If a page is shared with a user level that does not have access to a report that exists in the page,
then the report will not show up on the page when loaded by that users who cannot access the report.
In other words, a manager can create a report page that
includes important reports and share it with other user levels, but when an operator logs in who does not have access
to some of the reports in the report page, then the full report page will be loaded with empty space where the inacessible reports would be.
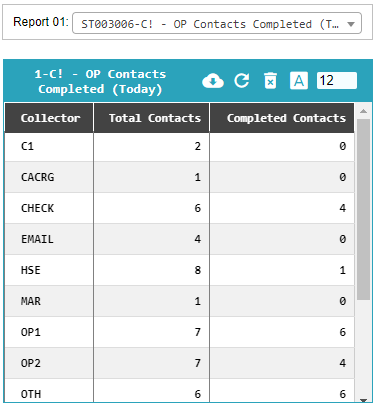
Add Circle Button add_circle_outline:
This Button is used to add a report container to the page. When a report
container is added to a page it will have a number in the title that indicates the sequence of the container,
as well as a dropdown list associated with the container. This dropdown list includes all the reports that this user
can access. This dropdown list is used to load the report in its respective container. Each
report container has the following features:
Report Set - Report Container
It can be grabbed from its title and moved to anywhere on the page.
It can be resized from the right-bottom corner to fit the desired width and height.
* If a report does not fit in the container that means the report needs to be resized to make the report fit in it.
Each report title starts with a number which indicates the dropdown list that controls it.
Download Buttoncloud_download:
this button is used to download data into CSV for tabular reports and to JPG for graph reports.
* Downloaded image dimensions change based on the container size.
Refresh Buttonrefresh:
this button is used to refresh report results.
Delete Button delete_forever :
this button is used to delete the current container.
* When a container is deleted, the container sequence will not change and the deleted number will not be reused.
Font Size font_download :
The field number controls the font size of the tabular report data. When the report container has a
graph report, then the settings button inside the graph report is responsible for controlling the font size
of the graph and also responsible for changing the style of the graph and also for zooming in/out the graph.
* settings button inside the graph report shows and hides the additional features mentioned above for graph reports.
Save Button save :
This button is used to save the current report set page. If the page is saved without any issues then it will notify the
user and the report set page will stay open. Alternatively, if the saving process had an issue you will receive an error message.
Build From a Saved Page:
This option is used to load a saved report set page and allow for modification. The modified version
of the report set page can be saved as a new report set page. The power of this options is that users can create templates,
and use those templates to create different report set pages.
This option combines two options: loading a saved page and building a new page. Both options will be executed at the same time.
* If no report page is selected then the
add_circle_outline
button of a new container will not be visible.
Report Set - Build From a Saved Page
F. Refresh Buttonrefresh:
This button reloads the page and all the information on the page will be lost.
G. Show Results in Table Format
This option shows results only when both of the following criteria are met:
* At least one report column is selected in the REPORT COLUMNS section.
* The "Save to Collect! library" checkbox is checked and the selected report type is
one of the types that uses the email body area (Rich Textbox).
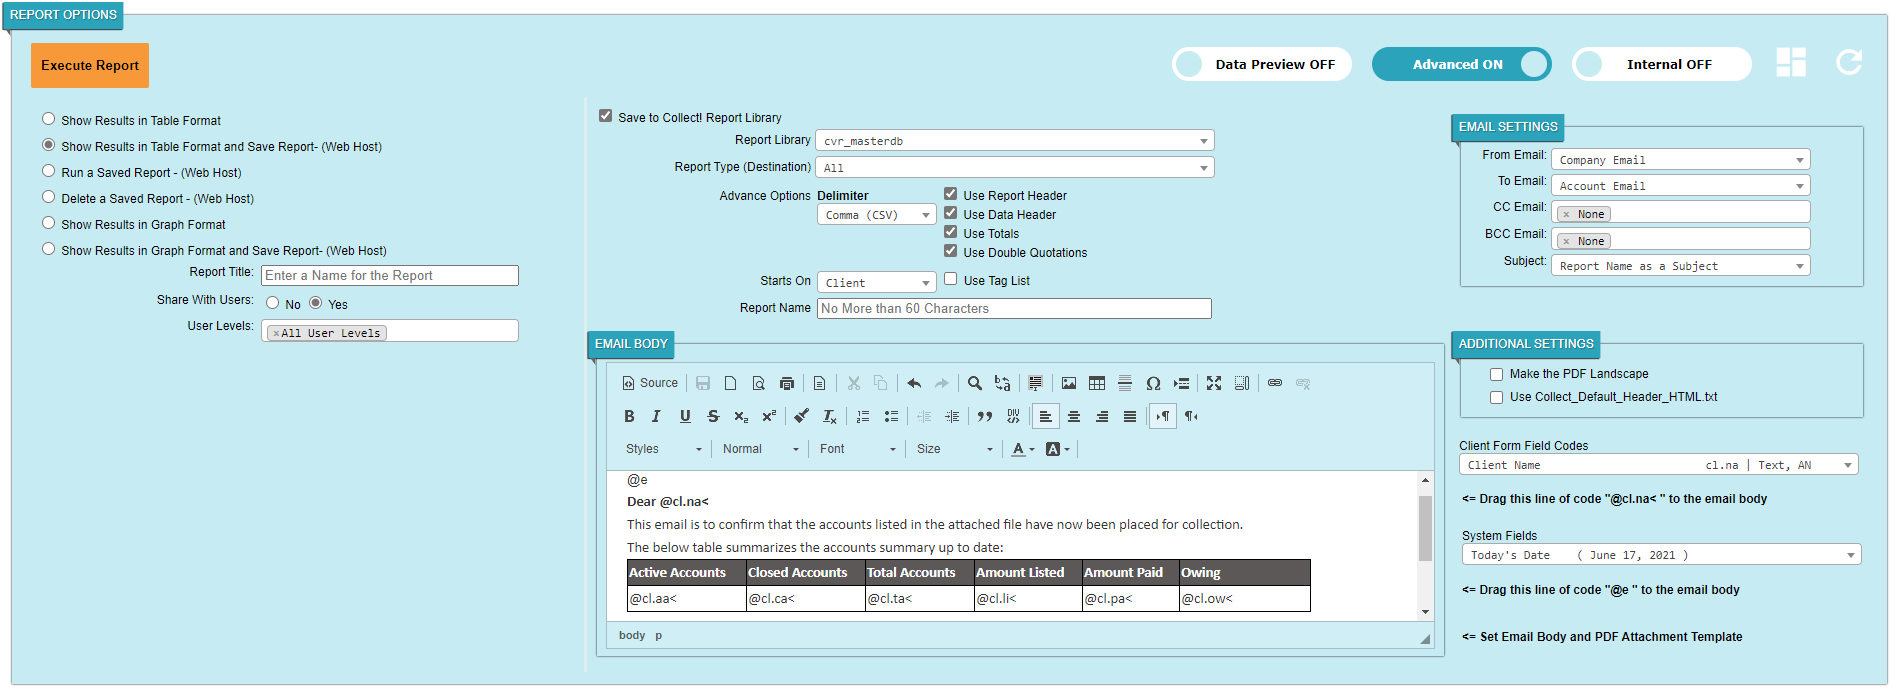
H. Show Results in Table Format and Save Report- (Web Host)
This option allows the current prepared report to be saved and viewed at a later time while showing the results.
Report Title: Give each report a unique name so that you can identify them later. While unique
names are recommended, duplicate names will not affect the report execution as each report has its own identifier.
If no report name is specified the report name will be filled with 'Unknown Report Name'.
Share With Users: When "Yes" is selected the user levels dropdown list will show up and by default it will
have "All User Levels" selected. In order to restrict access to custom user levels the "All User Levels" selection should be removed.
Any user with the selected user level can access the saved report and run it via the webhost. When "No" is selected only
the user who creates the report will have access to it.
* To show the newly saved report in the dropdown list, the report generator tool needs to be reloaded.
I. Run a Saved Report - (Web Host)
This option presents a dropdown list with the names of all the reports that
have been saved using this report generator tool. Select a report name and click the
"Execute Report" button to show the report results.
If there are no reports saved using this tool then the drowpdown list will be hidden and the Execute Report button
will only execute the 'G. Show Results in Table Format' option.
* Selecting a saved report will show the SQL statement and the column headers in the SAVED REPORT SCRIPT.
If the report is supposed to use filter then the report columns selection will be populated by default and it will disable
adding new columns to the report section as only one column is allowed to be passed and checks the distinct feature as well.
The user can apply as many filters as needed; if the user needs to join different tables then it is recommended to save the
filters needed as loading a saved filter will allow for creating joins between tables because columns cannot be added manually with
this particular report type.
* The reports will be sorted in the following order by default: first it lists all the reports that have been generated by
the user followed by all shared reports.
To easily identify report type read the two or three characters in front of the report number.
S - refers to a public report, T - refers to a tabular
format report, TF - refers to a tabular format report that can be filtered, G - refers to a graph format report,
GF - refers to a graph format report that can be filtered.
Run a Saved Report/Delete a Saved Report SQL Preview J. Delete a Saved Report - (Web Host)*
This option presents a dropdown list with the names of all the reports that
have been saved using this report generator tool by the current user. Select a report name and click the
Delete Current Report button to delete the report from the system. The report will be deleted and no results will be shown.
If there is no report saved using this tool then the drowpdown list will be inactive and
the button will only execute the 'G. Show Results in Table Format' option.
* Users can only delete reports that were created by themselves.
* Selecting a report name will show a preview of the SQL statement and the column headers.
* Data Preview feature can be used to show a sample result prior to deleting the report.
K. Show Results in Graph Format*
This option generates a graph. It is recommended to apply the following
statements to produce a meaningful graph:
Must apply replace null feature with the first column
Only the first six columns are used for the graph report. The first column creates the
x-axis. The remaining columns are used as graph data
It is recommended to group by the first column as to minimize the x-axis data
All y-axis data must be numeric and have an aggregate function
such as (sum, avg, count, min, max)
The minimum number of columns for graph data are two columns
If the dataset is large it is recommended to apply filters in order to
reduce the graph data size and make it easier to read
L. Show Results in Graph Format and Save Report- (Web Host)*
This option is a combination of Options H and K; if executed it generates a graph and saves it for WebHost.
M. Save to Collect! Report Library*
This option generates Collect! report codes and inserts the report into your Collect!
report library.
This function works as an additional feature to any of the above-mentioned options
with some limitations to the graph report format. In other words, while previewing data using this tool the system can also generate the
report codes and insert the report into Collect! report library.
* This option is not visible for user levels 97 and 98.
Save to Collect! library Options:
Report Library:
Contains all the report libraries available to the user to save generated reports.
Report Type (Destination):
This section addresses report destination and determines which
report type will be inserted into Collect!'s report library. Report types are explained below:
File:
Generates a report that will save the results into a file.
- Report Ending Code is [-CSV]/[-PIP]/[-TAB]/[-SMI]/[-COL]/[-CUS] which depends on the delimiter. This options uses the Report
Columns as the columns for the output data.
File(Sections-Sort By First Column):
Generates a report that will save the results into a file just like the above option but with an additional sorting and sub-totaling feature. If you wish
to use this feature, then the sorting criteria must be placed in the first column.
For example, if the first column contains client name in the report column (select section),
then the client name should be the first column in the sorting order (order by section).
This additional feature creates sub-sections and provides subtotals as
well as grand totals. This is useful for generating reports that will
group data by sections such as client name, operator, etc.
- Report Ending Code is [-CSVG]/[-PIPG]/[-TABG]/[-SMIG]/[-COLG]/[-CUSG] which depends on the delimiter. This options uses the Report
Columns as the columns for the output data.
Printer:
Generates a report that will output the data to a printer.
If the number of characters exceed 107 characters horizontally, then the report output will present in
a landscape view.
- Report Ending Code is [-PRN] and uses the Report Columns
as the columns for the output data.
Printer(Sections-Sort By First Column):
Generates a report that will output the data to a printer.
This uses the same process as the [File(Sections-Sort By First Column)].
If the number of characters exceed 107 then the report output will present in
a landscape view.
- Report Ending Code is [-PRNG] and uses the Report
Columns as the columns for the output data.
PDF Printer - Using Text Area*:
Generates a letter from the email body area and uses the PDF destination in Collect! reports to generate a PDF file.
- Report Ending Code is [-PDF] and uses the Email Body to output data.
Browser - Table Data:
Generates a report that will output the data to your browser in a tabular format.
- Report Ending Code is [-HTML] and uses the Report
Columns
as the columns for the output data.
Browser - Table Data (Sections-Sort By First Column):
Generates a report that will output the data to your browser in a tabular format.
This uses the same process as the [File(Sections-Sort By First Column)] described above.
- Report Ending Code is [-HTMG] and uses the Report
Columns
as the columns for the output data.
Browser - Text*:
Generates a report that will output the email body area to your browser
- Report Ending Code is [-LBRS] and uses the text
area to generate the output data.
Email Data (No Attachment)*:
Generates a report that will send the data as an email body.
- Report Ending Code is [-EMNA] and uses the Report
area to generate the output data.
Email Data (No Attachment - Sections-Sort By First Column)*:
Generates a report that will send the data as an email body.
This uses the same process as the [File(Sections-Sort By First Column)].
- Report Ending Code is [-ENAG] and uses the Report
area to generate the output data.
Email Data (PDF Attachment)*:
Generates a report that will send the data as a PDF email attachment and
uses the text area as an email body.
- Report Ending Code is [-EPDF] and uses the Report
Columns as the columns for the PDF file and the text area for email body.
Email Data (PDF Attachment - Sections-Sort By First Column)*:
Generates a report that will send the data as a PDF email attachment and
uses the text area as an email body.
This uses the same process as the [File(Sections-Sort By First Column)].
- Report Ending Code is [-EPDG] and uses the Report
Columns as the columns for the PDF file and the text area for email body.
Email Data (File Attachment)*:
Generates a report that will send the data as a file email attachment and
uses the text area as an email body.
- Report Ending Code is [-EFIL] and uses the Report
Columns as the columns for the file and the text area for email body.
Email Data (File Attachment - Sections-Sort By First Column)*:
Generates a report that will send the data as a file email attachment and
uses the text area as an email body.
This uses the same process as the [File(Sections-Sort By First Column)] described above.
- Report Ending Code is [-EFLG] and uses the Report
Columns as the columns for the file and the text area for email body.
Email - Text*:
Generates a report that will send the text entered in the text area as
an email body.
- Report Ending Code is [-LEML] and uses the text
area for email body.
Email - Text as PDF Attachment*:
This option uses the Email Body area as a PDF attachment and email body, with this type of report the
"<= Set Email Body and PDF Attachment Template" command can be used to divide the Email Body area into PDF
and email body sections.
- Report Ending Code is [-ETPD] and uses the text
area for the PDF and email body.
All:
Generates ALL the above listed reports in one click.
Graph:
This option is not usually visible, instead the Graph option automatically appears when one of the following options are selected
"Show Results in Graph Format" or "Show Results in Graph Format and Save Report- (Web Host)".
* When either of the two above-mentioned options is selected, only the applicable options for saving the report into the Collect! report library will be shown.
* This type of report is only visible when the Starts On is either 'Debtor' or 'Client'.
Advanced Options:
This section is only visible when there is a "file" keyword included in the report type (Destination).
Delimiter:
with this option the user can choose a custom column separator or a fixed width file format.
* If the fixed width option is selected then the number entered into the custom Delimiter will cascade to
all columns widths in the report columns section if they column does not have a value in the width field.
Use Report Header: with this option checked the report will
include "Collect! default header" which included the report names and date stamp.
Use Data Header: with this option checked the report
will include table column headers in the report.
Use Totals: with this option checked the report will
include totals for currency columns.
Use Double Quotations: with this option checked the report
will wrap each column result with a double quotations.
Starts On:
Currently this tool only provides three options: Everywhere, Debtor and Client. If 'Starts On' Client or 'Start On'
'Debtor' is selected more Report Type options become available in report Type (Destination) as it will include all
the email and letter type reports.
Use Tag List: This option is visible only when the 'Starts On'
is either 'Debtor' or 'Client'. When this option is checked, the report will use the client or debtor taglist
to be passed to the report when executing the report from Collect!.
** 'Starts On' has no effect when running a report using this tool on the webhost. However, report results will
be affected by the 'Starts On' when the report is run from Collect! Report Library.
Report Name:
Each report added to Collect! report library using this tool
will have a name and report type code. If no name is entered the report
will be listed as "Unknown Report Name" with the report type extension mentioned above.
** Only the first 60 characters of the report name are used as a name for the report.
Email body:
This area is used to generate an email body or a letter template or both. This section allows for copy and
pasting Word templates and adding Collect! printable codes.
* Shapes cannot be copied from Word. Images should be replaced with their actual URL once they are copied to the
email body.
Email Settings:
This section is shown only when the selected report is under the ___Email___ report group, this section allows
for overwriting Collect! default email behavior. Each subsection of this section has multiple options and they
are explained below:
* Company Email: This is the email that is entered on the company details form.
* Operator Email on Send: This is the email of the operator who is sending the email.
* Operator Email on Account: This is the email of the operator to whom the account is assigned, the
operator email is taken from operator form.
* Custom Email/Subject: This allows for entering a custom email or subject.
* Account email: means the debtor/client email on the form.
From Email: This option is used to overwrite the
From email
To Email: This option is used to overwrite the To
email
CC Email: This option is used to send a carbon copy
of the email to other emails
BCC Email: This option is used to send a BCC of the
email to other emails
Subject: This option is used to set a custom subject
for an email; custom subjects can include Collect! printable codes.
* With printable codes in the subject name, NONE of the printable codes may have
< sign at the end of it.
ADDITIONAL SETTINGS
This section is visible only when the selected report type has a PDF file attachment or if it uses the email body.
Make the PDF Landscape: with this option checked
the PDF attachment orientation will change to landscape.
Use Collect_Default_Header_HTML.txt:
with this option checked the PDF or email body will include the company's default header.
Client/Debtor Form Field Codes:
This option is visible only when an email body is visible. This option includes all Collect! printable codes for
either the client or debtor form depending on the report 'Starts On' dropdown list. Once a field is selected,
the Collect! printable code is generated and can be dragged into the email body area.
System Fields:
This option is visible only when an email body is visible. This option includes the most frequently used Collect!
printable codes.
Set Email Body and PDF Attachment Template:
This option is visible only when report type "Email - Text as PDF Attachment" is selected. This option can
be dragged into the email body to provide the user with the email and PDF attachment structure.
Once this structure has been used correctly the text command will disappear.
When user sees the "Set Email Body and PDF Attachment Template" line this means that the report is not going to work as
expected and indicates either a syntax error or that the correct layout is not set properly.
** The Report Options section and Query Generator section are divided by a horizontal bar, which can be used to show/hide
the report options and data preview sections.
2. QUERY GENERATOR:
This section is divided into two subsections, the Query Script section and the Report Generator section.
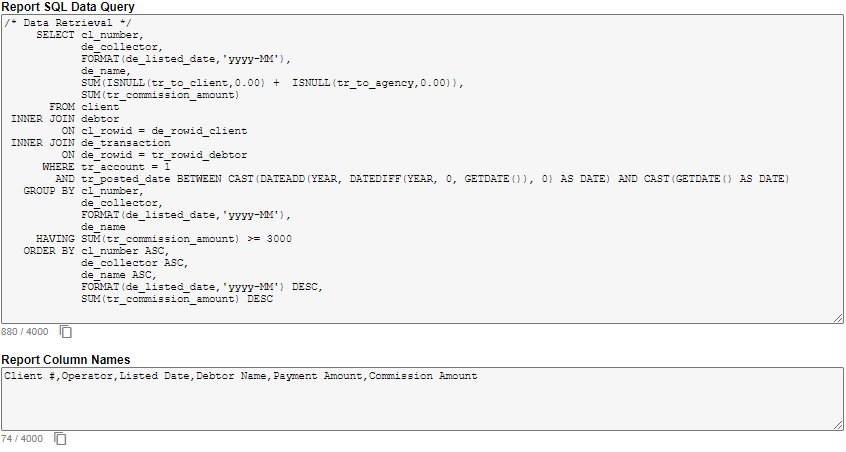
2.1 QUERY SCRIPT:
This section is used to view the SQL query script as well as the report column header names. This area is not modifiable and
it is generated dynamically based on the options selected in the Report Generator section. The content_copy button (if needed) could be used to
copy the script and run it directly via SQL Server Management Studio (SSMS) to generate the results.
* This section is not visible when the report generator tool is load with basic stream; however, it can be shown using
the vertical bar which separates the Query script and Report Generator sections.
* Total number of characters allowed is 4000. If the generated script exceeds the character limit the system will notify the user.
Query Script Section
2.2 REPORT GENERATOR:
This section controls what data is shown and in what order.
A. Report Columns (SQL SELECT Clause)
This section allows users to select the columns to be included in the generated report or other sections.
Report Columns Section
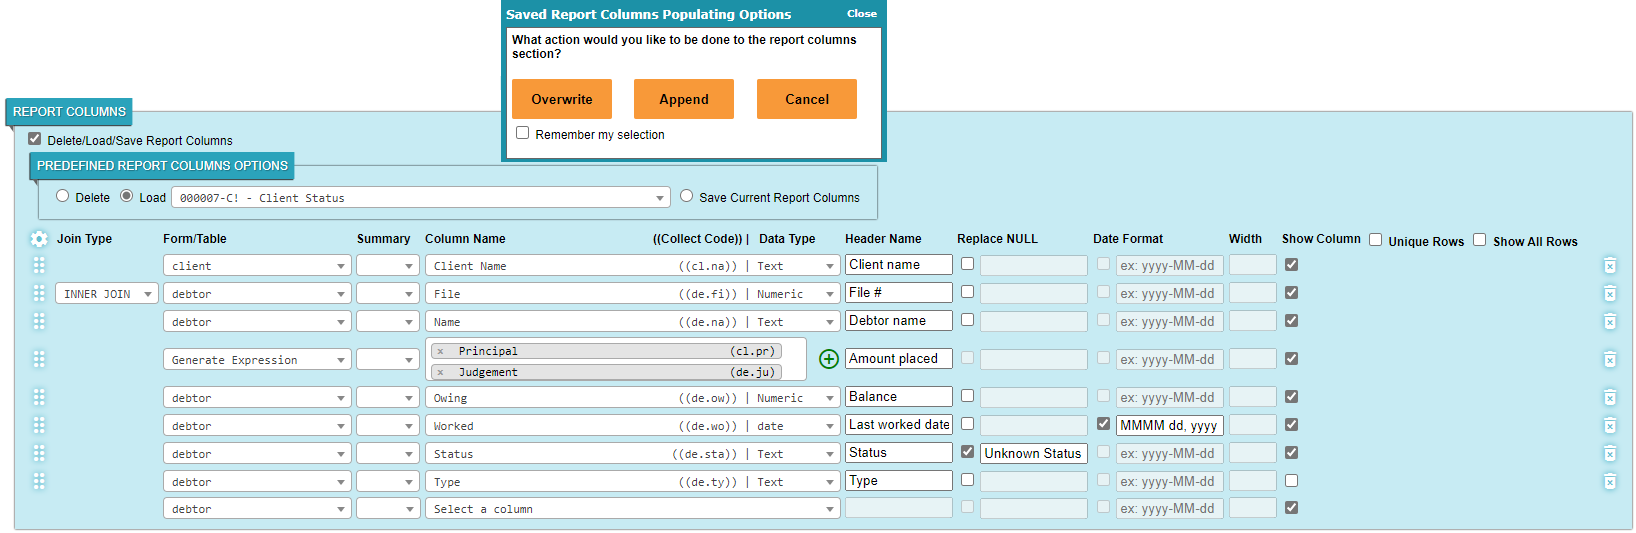
Delete/Load/Save Report Columns: When this option is checked 3 additional options will appear:
Delete: When this option is checked, and the report is executed,
the selected report columns will be deleted from the database.
Load: When this option is
checked the system will show a dropdown list that contains all the saved report columns. When selecting saved report columns
the report columns section will be loaded with the saved columns. There are two options for loading the report columns:
Loading Options: If there are no columns selected in the report column section, then the columns
will be loaded automatically. However, when there are columns selected in the report column section, then the user will be prompted to select
between the following options:
Overwrite: This option will clear the current report columns and populate the report with the saved ones.
Append: This option will append the additional report columns after all the current columns.
Cancel: This option will cancel the operation and will set the dropdown list selection to none.
* The users will be prompted every time they try to load saved
columns. This option however, can be avoided by checking Remember my selection. Once this option
is checked then the system will remember the selected option and will use that option without prompting the user.
Save Current Report Columns: This option will save the current
report columns to be used at a later time. When this option is selected it shows the ability to share the report columns
with other user levels. To understand Share With Users refer to it above.
* This checkbox is disabled when Run a Saved Report - (Web Host) option is selected.
Settings Button settings *:
This option is only shown when there is more than one
table/form in the report column area. This option provides users with ability to modify the join conditions between tables.
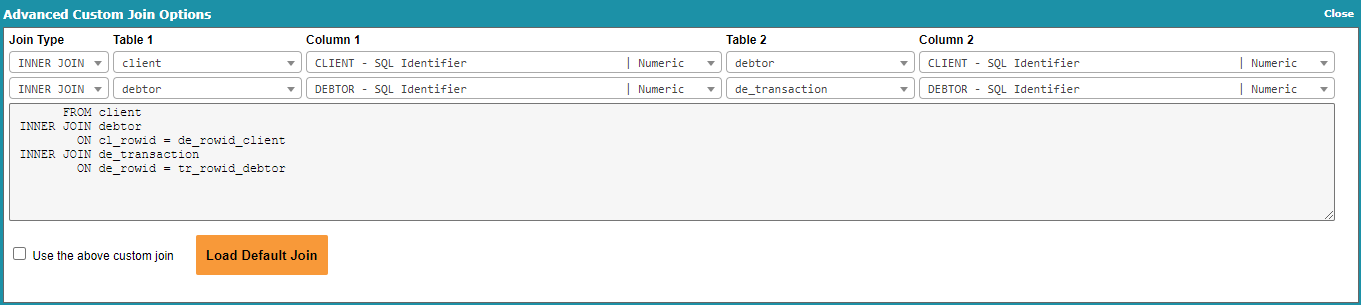
Custom Join Interface
Join Type: This indicates the join type between table 1 and table 2.
Table 1: This is the Form/Table name which filters the column 1 options.
Column 1: This indicates the column to be used for the join with table 2.
Table 2: This is the Form/Table name which filters the column 2 options.
Column 2: This indicates the column to be used for the join with table 1.
Script Area This area shows the join script that was generated based on the stated join conditions.
Use the above custom join: When this option is checked the default join behavior will be ignored and
the information that is used shown in the scrip area will be used for the join and the join dropdown lists will disappear from
the report columns.
** Custom join should be used after all the
report columns have been selected as mentioned above. Once this option is checked the report generator will ignore the automatic
joins. In other words, once this check box is selected, if another table is used in the report columns section it will not
appear in the join and no results will be generated unless the 'Load Default Join' button is clicked.
Load Default Join: This option will overwrite the custom join
and reloads the form with default join behavior.
Drag Indicator Button drag_indicator :
This icon is used to change the order of the rows (each row indicates a column in
the report result set).
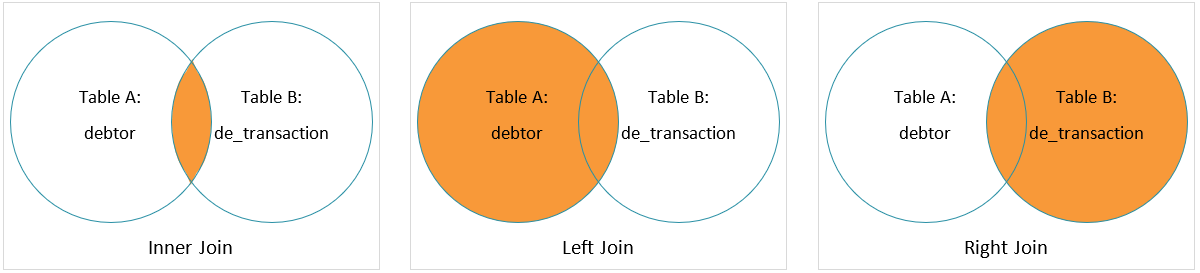
Join Type: This determines how the results are returned when tables are
joined.
The following section provides a simplified explanation of joins; let Table A be debtor and Table B be de_transaction:
Inner Join: Returns all debtors who have at least one transaction and each debtor will be listed
according to the number of transactions they have if a debtor has three transactions then it will show up
three times and if it does not have any transactions it will not show up.
Left Join: Returns all debtors regardless of having a transaction or not. Each debtor is going to be
listed according to the number of transactions they have if they a debtor has three transactions then it will show up
three times and if it does not have any transactions it will show up only once.
Right Join: This type of join is rarely used and it can be replaced by left join if
table A is de_transaction and table B is debtor. The idea of right join is similar to left join however this left
consider the table on the right as table A.
Join Types: Orange color area represents the portion of the data
that is retrieved from the tables based the join type.
Form/Table: This determines which form or table to retrieve data from,
this option controls what fields are shown in the column name dropdown list.
* Generator Expression: is neither a table nor a form and is used to add a custom expression or complex calculation columns.
Summary*: This is a SQL functionality
that is used to provide a summary and it works in the following way:
When the selected column is of type Numeric then these options are allowed (COUNT, SUM, AVG, MAX, MIN, and none*),
otherwise, only (COUNT, MAX, MIN and none*) are allowed.
* When a column does not exist in the group by section then it does not allow for selecting the none option.
If a column exists in a group by section and it has date format applied then same date format should be applied to the
column in order to allow for selecting summary option of none.
Column Name ((Collect Code)) | Data Type: This lists all the fields
that are available for reporting depending on the form/table.
The first portion of the field states the name of the field or the alias (if the field has an alias)
The second portion of the field is the Collect! printable code for the field.
The third portion of the field is the type of the column, which provides
the user with information about returned value of the column.
* If the selected value for Table/Form is Generator Expression then all the currency fields from all the tables are
shown in the dropdown list and it allows for multiple selection of the columns in order to generate complex calculated columns.
Selecting columns does not have any effect on the results set as they have to be added using the add_circle_outline.
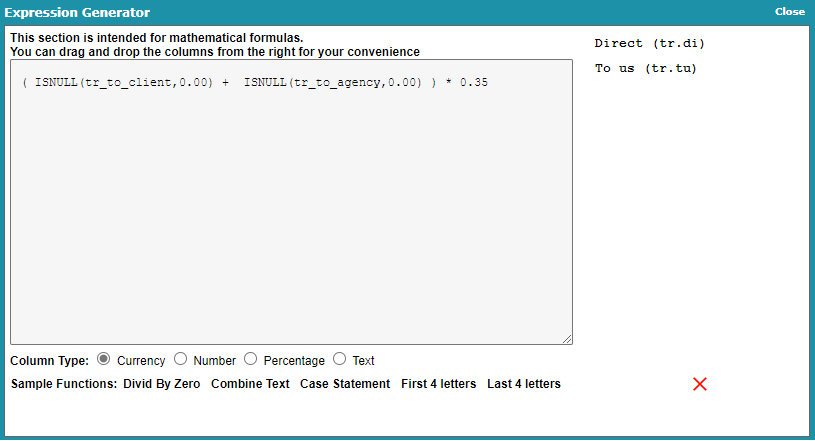
Add Circle Button add_circle_outline:
When this button is clicked it will open the
Expression Generator Window. When this window is opened for the first time with this row set then it will be empty, otherwise,
it will be loaded with the existing expression for modification. The columns selected in the column name area are there only to
assist you. Beyond that they serve no purpose for the report generator since report uses the expression generator area to produce results. It
is the user's responsibility to make sure that the codes typed into the Expression Generator area are all valid SQL commands. The Expression Generator Form
includes the following:
Script Area: This area is used for the custom formula or computed column information.
Column Type: This determines the type of the columns as this area is meant for currency,
however, other types could be used if needed.
Sample Functions: Any of the listed options could be dragged into the expression area to provide
the user with a sample code on how to use that particular function.
Column Names Area: Any of the listed columns could be dragged into the expression area with the
proper database schema of the column which can later be used with other math functions.
Reset Button X: This will clear the expression area.
* If the add_circle_outline button is red it means that no expression is generated, if it is green then it means an expression is
been generated and it will show up in the report.
Expression Generator Interface
Header Name: This indicates the name of the column when the results
are shown in the report.
* All the commas in the field are replaced with semi-colons;
Replace NULL: This option is used
to set a default value for the field on the output if the field does not have an initial value set in the database.
Date Format*:
This option is used to format date fields on the output. The following are the most common formatting commands:
Days can be formatted using d
d one digit day
dd Two digit days
ddd Short day name Sun
dddd Full day name Sunday
Months can be formatted using M
M one digit month
MM Two digit months
MMM Short month name Jan
MMMM Full month name January
Years can be formatted using yy
yy Two digit years 21
yyyy Four digit years 2021
Width*: This option is only activated
when 'Insert to Collect! Report Library' is checked and the delimiter type is fixed width.
* This file is populated with values when it is set globally on the custom delimiter field.
The number indicates the width of the column when the report is run from Collect!.
Show Column: This option is used to control whether a column should be
shown in the result set or not. This feature is useful when the user wants to only select debtor information and filter by client
number as the client number does not exists in the debtor table in the database. With this feature the user can select a field
from the client table and then uncheck show column for that particular field. With that setting the client table will be added to the rest
of the sections so it can be used for filtering, sorting and so on, but not show up in the actual report.
Unique Rows: When this option is checked the system will retrieve unique rows
of data only. If multiple columns are selected then the entire row has to be unique in order for a row to be considered
a unique.
Show All Rows: By default the report generator only retrieves the top 10,000
rows on the result page and 10 rows on the data preview section when this option is unchecked. If the user wants to see
all the data then checking this option will show all the data. Retrieving all data may take some time depending on how many
records need to be retrieved from the database by the query.
Delete Button delete_forever :
This button is used to remove the current row from the report columns list.
B. Filters (SQL WHERE Clause)
This section allows users to apply filters to the results.
Filters Section Filters are only enabled when there is at least one column selected
in the report columns section
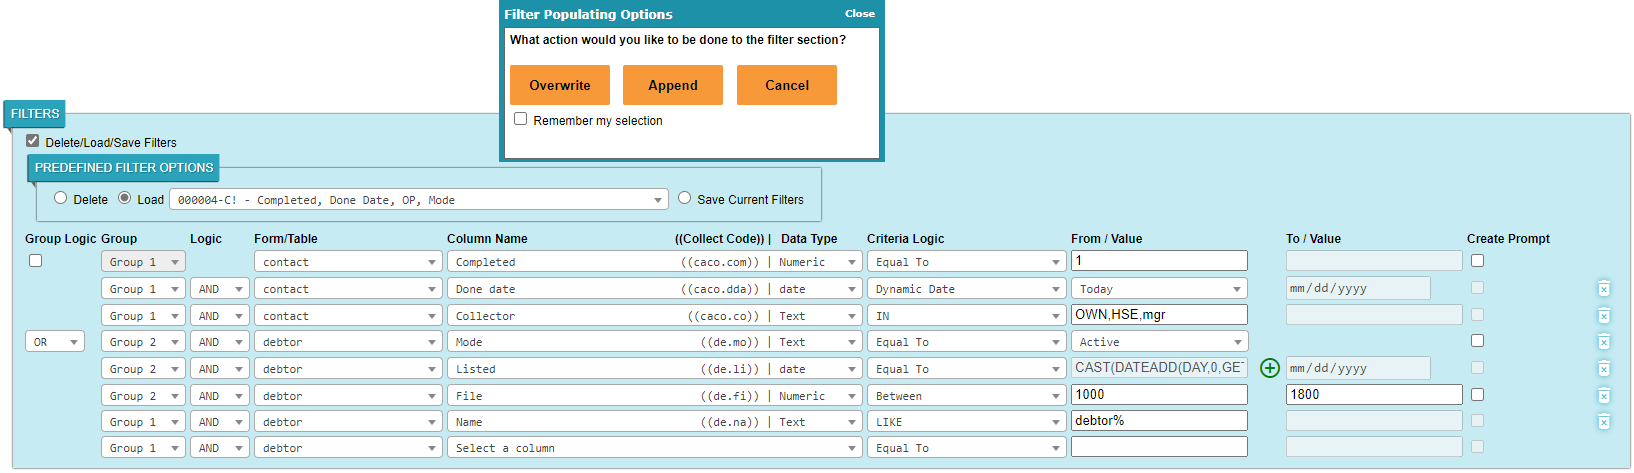
Delete/Load/Save Filters: When this option is checked
3 more options will become available:
Delete: When this option is checked the selected filter will be deleted from the database when the report is executed.
Load: When this option is checked a dropdown list will appear that shows all the saved filters.
When selecting a saved filter the filter section will be loaded with the saved filters. There are two options for loading the filters:
Loading Options: If there are no filters applied in the filter section, then the filters
will be loaded automatically. However, when there are one or more filters already applied the user will be prompted to select
between the following options:
Overwrite: This option will clear the filter section and populated it with the saved ones.
Append: This option will append the additional filters to the end of the current filters.
Cancel: This option will cancel the operation and will set the dropdown list selection to none.
* The users will be prompted every time they try to load a saved
filter, this option however, can be avoided by checking Remember my selection. Once this option
is checked then it will remember the selected option and will use that option to avoid prompting the user.
Save Current Report Filters: This option will save the current
filters to be used at a later time, this option when selected it shows the ability to share the filters
with other user levels. To understand Share With Users refer to it above.
Group Logic*: Filters can contain multiple sets of logic to validate
if a record qualifies for retrieval or not.
Group Logic Checkbox (Extended Group Logic):
This checkbox is only visible one time. Once it has been selected it will make Group 1 fixed.
In other words, it adds a three-level grouping logic and the logic in Group 1 always has to be true in order for a record to
qualify for retrieval.
Group Logic Dropdown List: This dropdown determines the
logic between groups; for example, a user might want a record to be retrieved when either Group 1 or Group 2 logic
is true or when both of them are true.
Group*: This option sets multiple groups of
logic to be considered as one set of logic. When a filter is applied then Group 1 is always applied and the rest
of the groups are optional.
* When operator user level is 97 or 98 then only Group 1 is available.
Logic: This dropdown determines the logic between each row of logic (filter).
Form/Table: This determines which form or table to retrieve data from,
this option controls what fields are shown in the column name dropdown list.
Column Name ((Collect Code)) | Data Type: This lists all the
fields that are available for reporting depending on the form/table.
The first portion of the field includes the name of the field or the alias of the field if the field is aliased.
The second portion of the field is the Collect! printable code for the field. The third portion is the type of the column, this provides
the user with information on the returned value of the column.
Criteria Logic: This indicates the logic action that is going to be used and changes based on column type. The options are explained below:
Equal to: Retrieves all the records that match the compared value.
Not equal to: Retrieves all the records that DO NOT match the compared value.
Greater than: Retrieves all the records that are Greater than the compared value.
Greater than and equal: Retrieves all the records that are Greater than or equal
to the compared value.
Lesser than: Retrieves all the records that are Lesser than the compared value.
Lesser than and equal: Retrieves all the records that are Lesser than or equal
to the compared value.
Between: Looks for record values between two values. When this option is selected
it will enable the To value field for a record to be retrieved. This option is inclusive which means that the from and to values are
included in the compared values.
IN: Searches for multiple values in a single field and retrieves all
the records that contain at least one of the compared values. The values must be separated by a comma and not have a
space added between commas unless it is part of the value.
NOT IN: Searches for multiple values in a single field and retrieves all
the records that DO NOT contain ANY of the compared values. The values must be separated by a comma and not have a
space added between commas unless it is part of the value.
LIKE: Completes a partial matching using wild cards or patterns (ex: % or _ or ^ or [A-Z]) and
retrieves the records that contain part of the text. If a user wants to search for an actual wild card as a character
then it should be wrapped between[ ] to search for any record that starts with a % sign in the name then your statement would
be "de_name LIKE '[%]%'".
NOT LIKE: Completes a partial matching using wild cards or patterns (ex: % or _ or ^ or [A-Z]) and it
retrieves the records that DO NOT contain part of the text. If a user wants to search for an actual wild card as a character
then it should be wrapped between[ ] to search for any record that starts with a % sign in the name then your statement would
be "de_name NOT LIKE '[%]%'".
IS NULL: Retrieves all records where a field value is NOT set in the database.
IS NOT NULL: Retrieves all records that have a field value set in the database.
IS EMPTY: Retrieves all records that have a field value NOT set in the database or is empty.
IS NOT EMPTY: Retrieves all records that have a field value set in the database or NOT empty.
CUSTOM SQL: When selected this option will ignore the criteria option and it is the user's
responsibility to type custom SQL coding in the space including the column name.
IS CHECKED: This option is only visible when the selected column is of type flag and retrieves all the records
that have the checkbox checked inside Collect!
IS NOT CHECKED: This option is only visible when the selected column is of type flag. When this option is selected it retrieves all the records
that have the checkbox NOT checked inside Collect!
Dynamic date: This option is only visible when the selected column is of type date.
When this option is selected the 'From' value field will be replaced with a dropdown list that includes the
following options:
Today
Yesterday
Tomorrow
This Week
Last Week
Next Week
This Month
Last Month
Next Month
Year To Date
This Year
Last Year
Next Year
From / Value: This field is used for
comparing the values for the filter. This field changes based on the column type. For example: for column type 'Numeric' it
only allows for numbers unless the selected criteria is IN, NOT IN, LIKE, NOT LIKE or Custom SQL.
To / Value:This field is used for
comparing the values for the filter. This field is only enabled when the criteria logic Between is
selected.
Add Circle Button add_circle_outline:
This option is only visible with columns of type date, this option when clicked
will disable the 'From/To' field and open the following window which is used for date calculation:
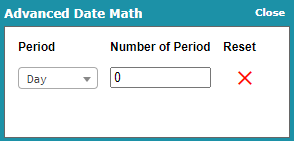
Date Math Interface
Period: This option sets the period.
Number of Period: This option sets the number
to be added or subtracted from the period selected. For example, if the period is 'Day' and the user types '4' then the system will add
four days to the current day; this changes dynamically every day. If the user wants to see what happened in the
system four days ago then -4 should be used. If 0 is passed then the system will return information for the current day.
Reset: Selecting 'Reset' will set the date field back to its original state. This is useful when the user
decides not to use the date math function and manually enters a date instead.
* If the add_circle_outline button is red it means that no date math is applied; if it is green it means that date math is applied.
Create Prompt*: This option is only activated
when logic is included in the script; an empty logic row will disable this checkbox. This option has no effect on
reports that are run via the webhost; the option is triggered when the report is saved to Collect! report library.
* This checkbox is not enabled by any criteria that does not use the 'From' field and IN, NOT IN, LIKE, NOT LIKE, CUSTOM SQL or Dynamic Date.
Delete Button delete_forever :
This button is used to remove the current row from the filters list. Note that the first filter cannot be deleted; if the user would like to not use
the first filter then it could be changed to Select a column.
C. Group By (SQL GROUP BY Clause)*
This section is used to provide aggregate summaries for the columns which are
selected in the report columns.
Group By Section This Group By section is only enabled when there is at least one column selected
in the report columns section and this utitity and is working in the Advanced stream ON (see the top of this document for Basic, Advanced and Internal Streams).
Form/Table: This determines which form or table to retrieve data from;
this option controls what fields are shown in the column name dropdown list.
Column Name ((Collect Code)) | Data Type: This lists all the fields that are available for reporting depending on the
form/table.
The first portion of the field shows the name of the field or the alias if the field has been aliased.
The second portion of the field is the Collect! printable code. The third portion is the type of the column; this provides
the user with information on the returned value of the column.
Date Format:
This option is used to format the date fields on the output. The following section lists the most common formatting commands:
Days can be formatted using d
d One digit day
dd Two digit days
ddd Short day name Sun
dddd Full day name Sunday
Months can be formatted using M
M One digit month
MM Two digit months
MMM Short month name Jan
MMMM Full month name January
Years can be formatted using yy
yy Two digit years 21
yyyy Four digit years 2021
This button is used to remove the current row from the group by list.
D. Summary Level Filters (SQL HAVING Clause)
This section is used to filter the data after the 'Group By' results have been obtained. In other words, this section is used to filter
records from the summary data. (This section is modifiable when there is at least one field selected in the Group By section).
Group By Section Only allowed when there is at least one column selected in the
Summary Level Filters
Logic: This dropdown determines the logic between each row of logic (filter).
Summary: This is a SQL functionality
that is used to provide a summary. It works in the following way:
When the selected column is of type Numeric then the following options are allowed: COUNT, SUM, AVG, MAX, MIN, and none*;
when the selected column is of a type other than Numeric, then only COUNT, MAX, MIN and none* are allowed.
* When a column does not exist in the 'Group By' section, then it does not allow selecting the 'None' option.
If a column exists in the 'Group By' section and has a date format applied, then the same date format should be applied to the
column in order to allow the user to select the summary option of none.
** If none is used with a column then it is recommended to use it in the filter section rather than using it here,
as in that case both sections are treated the same if no summary function is applied on the logic. As you can see from
the Summary Level Filters Screenshot Listed column does not use any summary functions thus it could have been used
in the where clause if date formats were available in Filters section it could still can be used using Custom SQL criteria.
Form/Table: This determines which form or table to retrieve data from;
this option controls what fields are shown in the column name dropdown list.
Column Name ((Collect Code)) | Data Type: This lists all the
fields that are available for reporting depending on the form/table.
The first portion of the field includes the name of the field or its alias, if it has been aliased.
The second portion of the field is the Collect! printable code. The third portion is the type of the column, this provides
the user with information on the returned value of the column.
Criteria Logic: This indicates the logic action that is going to be used and changes based on column type. The options are explained below:
Equal to: Retrieves all the records that match the compared value.
Not equal to: Retrieves all the records that DO NOT match the compared value.
Greater than: Retrieves all the records that are Greater than the compared value.
Greater than and equal: Retrieves all the records that are Greater than or equal
to the compared value.
Lesser than: Retrieves all the records that are Lesser than the compared value.
Lesser than and equal: Retrieves all the records that are Lesser than or equal
to the compared value.
Between: This option looks for records value between two values, once this option is selected
it will enable the To value field for a record to be retrieved. This option is inclusive
which means from and to values are included in the compared values.
IN: This option is used to search for multiple values in a single field and it retrieves all
the records that contain at least one of the compared values; the values must be separated by a comma and not have a
space added between commas unless it is part of the value.
NOT IN: This option is used to search for multiple values in a single field and it retrieves all
the records that DO NOT contain ANY of the compared values; the values must be separated by a comma and not have a
space added between commas unless it is part of the value.
LIKE: This option does a partial matching using wild cards or patterns (ex: % or _ or ^ or [A-Z]) and it
retrieves the records that contain part of the text. If a user wants to search for an actual wild card as a character
then it should be wrapped between[ ]. To search for any record that starts with a % sign in the name then your statement would
be "de_name LIKE '[%]%'"
NOT LIKE: This option does a partial matching using wild cards or patterns (ex: % or _ or ^ or [A-Z]) and it
retrieves the records that DO NOT contain part of the text. If a user wants to search for an actual wild card as a character
then it should be wrapped between[ ]. To search for any record that starts with a % sign in the name then your statement would
be "de_name NOT LIKE '[%]%'".
IS NULL: This option is used to retrieve all records that have the field value is NOT set in the database.
IS NOT NULL: This option is used to retrieve all records that have the field value is set in the database.
IS EMPTY: This option is used to retrieve all records that have the field value is NOT set in the database or empty.
IS NOT EMPTY: This option is used to retrieve all records that have the field value is set in the database or NOT empty.
CUSTOM SQL: This option when selected it will ignore the criteria option and it will be users
responsibility to type a custom SQL coding there including the column name.
IS CHECKED: This option is only visible when the selected column is of type flag and retrieves all the records
that have the checkbox checked inside Collect!
IS NOT CHECKED: This option is only visible when the selected column is of type flag and it retrieves all the records
that have the checkbox NOT checked inside Collect!
From / Value:This field is used for
comparing the values for the filter. This field changes based on the column type. For example, for column type numeric it
only allows for numbers unless the selected criteria is IN, NOT IN, LIKE, NOT LIKE or Custom SQL.
To / Value: This field is used for
comparing the values for the filter. This field is only enabled when the criteria logic Between is
selected.
Create Prompt: This option is only activated
when logic is included in the script, an empty logic row will disable this checkbox. This option has no effect on
reports that are run via the webhost, it is only triggered when the report is saved to Collect! report library.
* This checkbox is not enabled with any criteria that does not use the 'From' field and IN,NOT IN, LIKE, NOT LIKE, CUSTOM SQL and Dynamic Date.
Delete Button delete_forever :
This button is used to remove the current row from the summary level filters list.
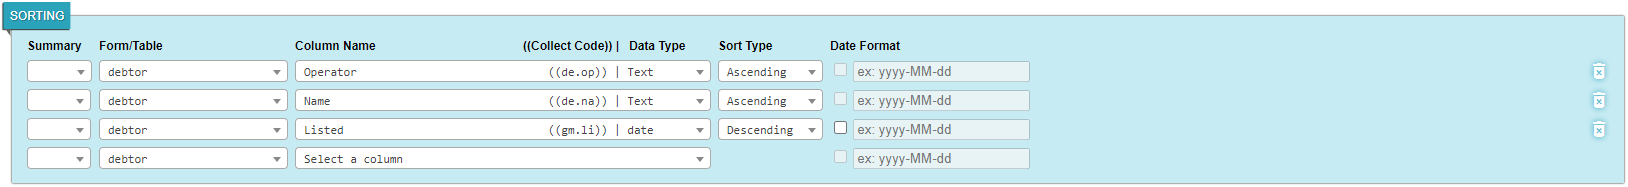
E. Sorting (Order By in SQL)
This section is used to sort the output data.
Sorting Section Sorting is only enabled when there is at least one column selected in
the report columns section. This section is used to change the sorting options for the reult set
Form/Table: This determines which form or table to retrieve data from,
this option controls what fields are shown in the column name dropdown list.
Summary*: This is a SQL functionality
that is used to provide a summary and it works in the following way:
When the selected column is of type Numeric then these options are allowed: COUNT, SUM, AVG, MAX, MIN, and none*; if the selected column is of any type other than
numeric only COUNT, MAX, MIN and none* are allowed.
* When a column does not exist in the group by section then it does not allow for selecting the 'None' option. If a column exists in a 'Group By' section
and has a date format applied then the same date format should be applied for the column in in order to allow the user to select a summary option of none.
Column Name ((Collect Code)) | Data Type: This lists all the fields
that are available for reporting depending on the form/table.
The first portion of the field includes the name of the field or its alias, if the field is aliased.
The second portion of the field is the Collect! printable code. The third portion is the type of the column, this provides the user with some information on the returned value of the column.
Date Format*:
This option is used to format date fields on the output. The following section lists most common formatting commands:
Days can be formatted using d
d one digit day
dd Two digit days
ddd Short day name Sun
dddd Full day name Sunday
Months can be formatted using M
M one digit month
MM Two digit months
MMM Short month name Jan
MMMM Full month name January
Years can be formatted using yy
yy Two digit years 21
yyyy Four digit years 2021
This button is used to remove the current row from the sorting list.
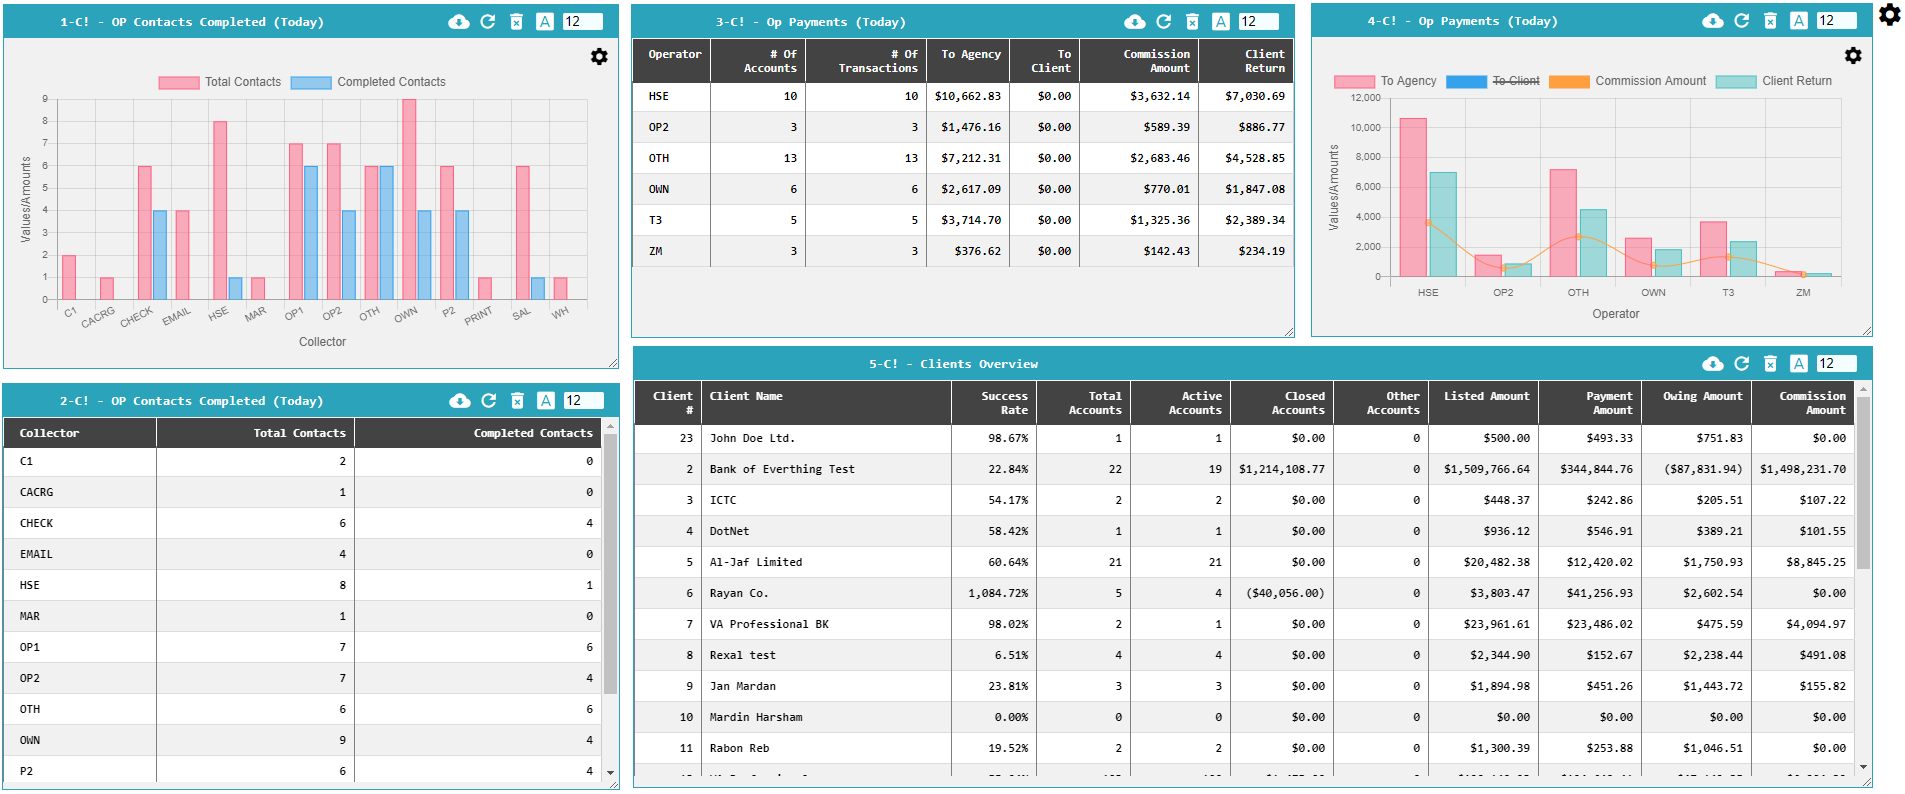
3. RESULT PAGE:
The result page is opened in another tab when the 'Execute Report' button is clicked or F9 is pressed.
Depending on the selected report option it shows data in these following types:
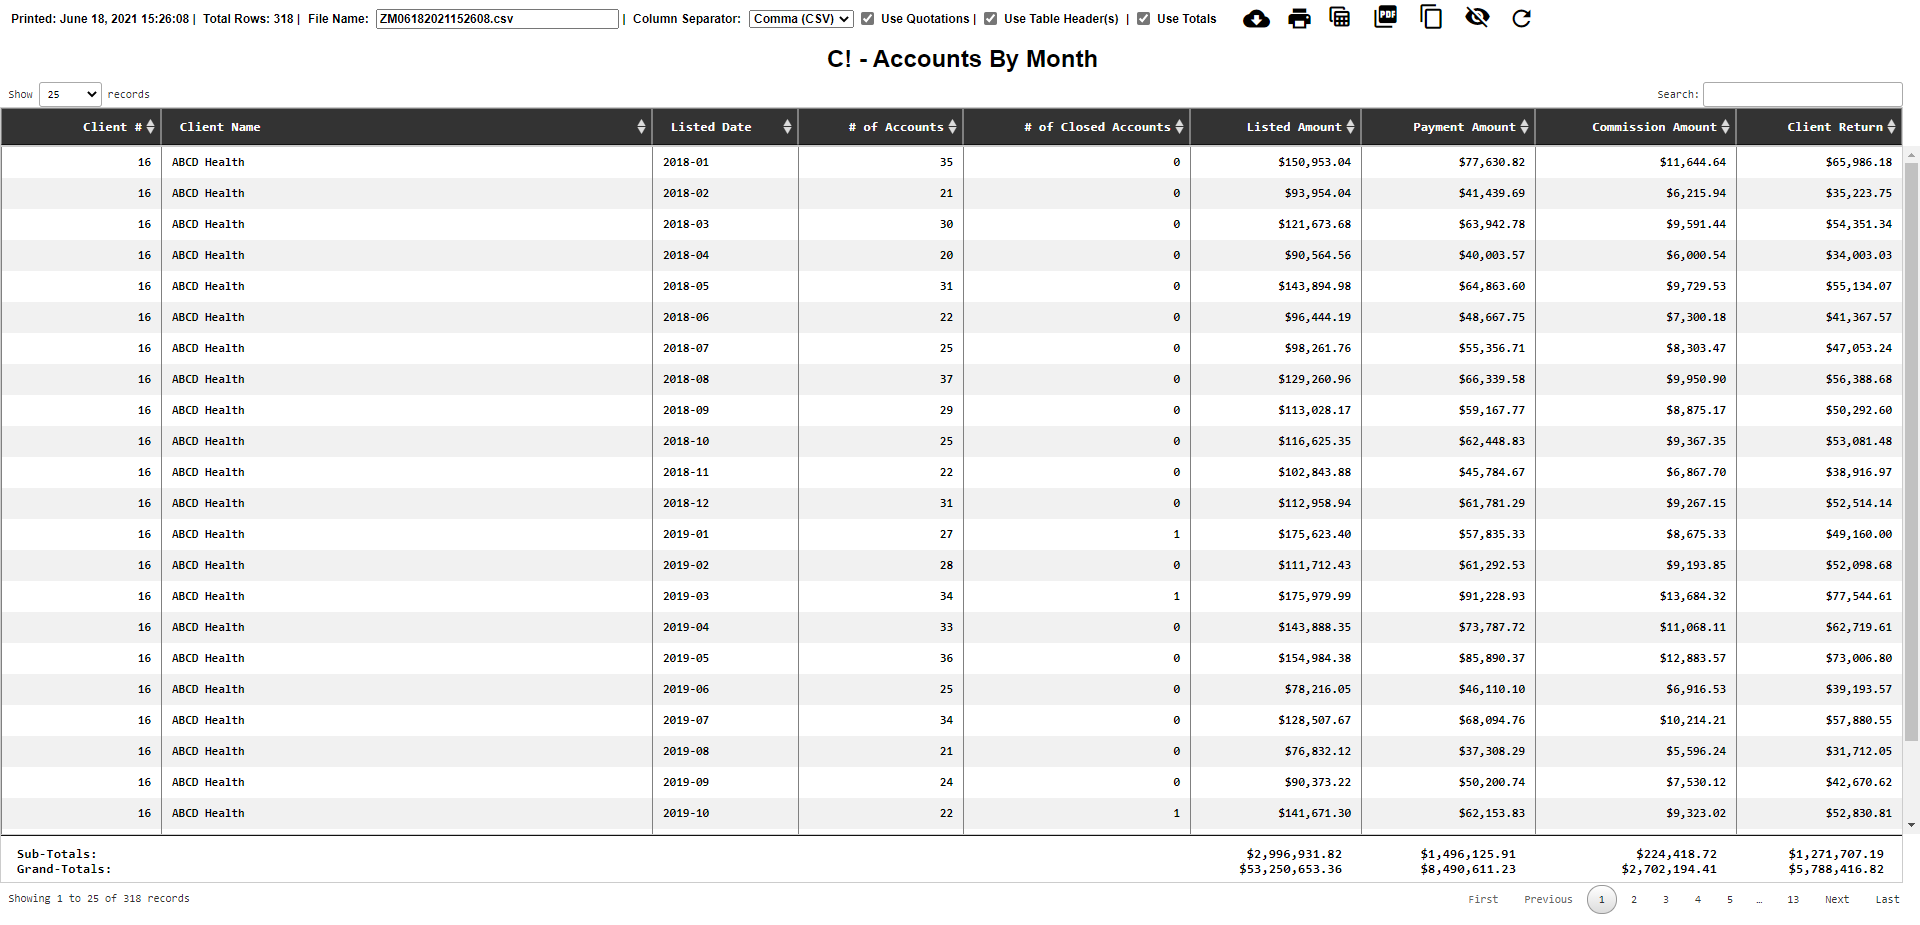
Tabular Result:
This page shows data in tabular format. The table can be sorted, searched and downloaded.
This page has two main components: the Control Menu and the Table Area. Both are explained in detail below the table image that follows.
Tabular Format Result
Control Menu:
This set of options are mostly related to the options available to download data. Your options are explained below:
Printed: This indicates the date and time the result set was generated.
Total Rows: This indicates the total number of rows this query has generated. By default queries will show up to 10,000
rows. If there are more than 10,000 rows then an additional information item will appear stating
Total Rows: 10,000 of {Total Number of Possible Records}.
File Name: This field acts as the file name for the file when downloaded.
* File Name can be changed; by default the file name starts with the Operator ID, followed by the date and time the result page was
generated, followed by the file extension.
Column Separator: This option controls the column separator and also tries to control the
file extension in the file name field based on the type of column separators.
Use Quotations: When this option is checked each cell value will be wrapped with double quotations
when the data is downloaded.
Use Table Header(s): When this option is checked the table header values will
be included in the file when the data is downloaded.
Use Totals: This option is only visible when there is at least one column with currency type.
When this option is checked it will show a subtotal and a grand total for each currency column. These totals will
be included* in the file when the data is downloaded.
* Only using the download and print buttons will include subtotals.
Download Buttoncloud_download:
This button uses all the previous features mentioned, this button should be
default button for downloading data as a file.
* Only the current page of the data is downloaded using this button to download all the data show all records must
be selected.
Printer Button print :
This button provides the user with a printable version of the table that
could be printed to a printer or a PDF file.
* Only Use Totals checkbox affects this button.
* All records are downloaded.
* All sorting and columns visibilities are set to their original states when this button is used.
Table Button table_view :
This button downloads data as an excel file.
* All records are downloaded; the downloaded file does not include totals.
PDF Button picture_as_pdf :
This button downloads data as a PDF file. The system determines whether a file should
be downloaded in portrait or landscape orientation (if the report has 7 columns and more then it will change the PDF orientation
to landscape).
* All records are downloaded. The downloaded file does not include totals.
Copy Button content_copy :
This button copies all record data and it can be pasted anywhere.
Visibility Button visibility_off :
This button is used to show and hide columns in the data section.
* This feature affects all type of downloaded files except for the print button.
Refresh Button refresh :
This button is used to refresh the results.
Report Title: This is the report title. If the report is been generated from a saved report or
it has been saved then the title will be the report name passed from the report generator otherwise,
the title will be Dynamic Report.
Table Area:
This area is used to show the data and it has three main sections:
Records and Data Controls Sections: These sections show the data
and are divided into two sub-sections: the upper-part and the lower-part:
Upper-part:
Show Records: By default 25 rows of the data is visible in each page; this
number can be changed to your preferred number of rows per page.
Search: This search field can be used to look up any value in the table.
The subtotals and paging buttons are adjusted according to the search result.
Column Header: The header is considered a part of the data section. However, each
column name features up and down arrows which can be used to sort the data according on the current column.
* Data on this page can only be sorted by one column at a time, if both up and down triangles are shown,
then it indicates that sorting has not been applied, if an up or down triangle is shown it means that
the data is presented in ascending order or descending order.
Lower-part:
Showing 1 to 25 of {nn} records: This line of text provides the user with a quick
overview of the total number of records in the report.
Paging Buttons: These paging buttons are controlled by the actual number of rows and the
Show Records drowpdown list. These buttons are used to navigate through the results.
Data Section: This area shows the records that were retrieved by the query.
Totals Section: This area provides totals for any currency fields. Subtotals indicates the totals
for the data shown on the current page, Grand Totals indicates the overall totals of all the records.
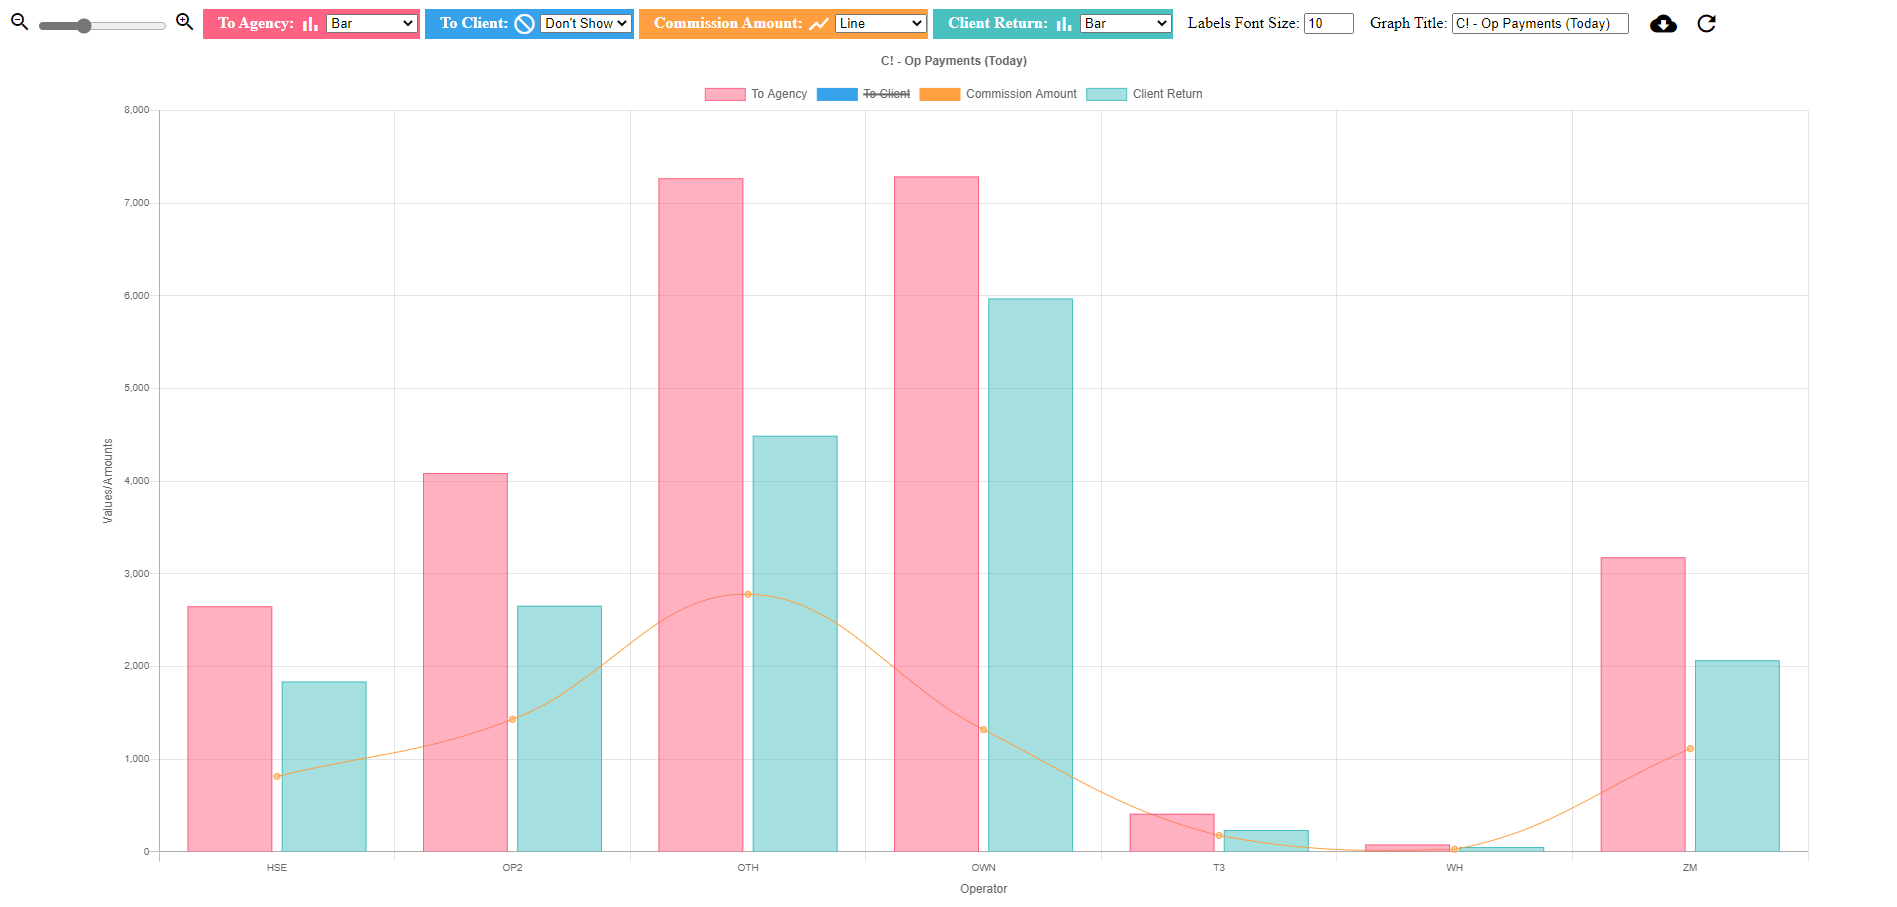
Graph Result:
This page shows data in a graph format. The graph style can be changed and the graph can be downloaded.
The page has two main components: Control Menu and Graph Area. Both are described below the following image.
Graph Format Result
Control Menu:
This set of options control the graph style. Each option is explained below:
Zoom In/Out: This option is used to zoom in and out the graph.
Graph Columns Area: This area can include up to five columns. Each column will be mapped
by its color to the graph data point. The dropdown list can be used to apply a custom style to the graph; the image shows 3 choices: Bar, Line and Don't Show.
By default the graphs are loaded with a Line type, but are easily changed using the Graph Columns Area as described.
Lable Font Size: This field is used to control the graph X and Y labels font sizes.
Graph Title: This field is used to change the graph title. Once you have changed the graph title,
your new title will appear on downloaded versions of this graph.
Download Buttoncloud_download:
This button is used to download the graph as an image.
Refresh Buttonrefresh:
This button is used to refresh the results.
Graph Area: This area shows the actual query results. Hovering over a data point will show you the value and label for that particular
data point.
Was this page helpful? Do you have any comments on this document? Can we make it better? If so how may we improve this page.


Was this page helpful? Do you have any comments on this document? Can we make it better? If so how may we improve this page.
Please click this link to send us your comments: helpinfo@collect.org